

This is a simple example of reading and visualizing data using the FreeBoard node from a Node-RED flow. We’ll be using the Cloud based FRED service as our Node-RED engine and visualizing data from a web weather service . This guide will show you how to:
- if you don’t already have one, set up a FRED account and create your first Node-RED flow
- set up an openweathermap node in FRED using the built in node
- display the data from the openweathermap node using the FreeBoard display node
What is Node RED?
Node-RED is a visual tool for wiring the Internet of Things developed by IBM Emerging Technology and the open source community. Using Node-RED, developers wire up input, output and processing nodes to create flows to process data, control things, or send alerts. It works by allowing you to wire up web services or custom “nodes” to each other, or to things, to do things like:
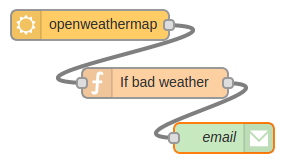
- Send an email on a rainy weather forecast.
- Push sensor data to services like Twitter.
- Perform complex analysis on data with ease.
If you’re new to Node RED you might find our Introduction to Node RED tutorial very helpful.
What is FRED
Front End for Node-RED (FRED) manages instances of Node-RED for multiple users in the cloud. We manage and optimize your instance of Node RED so you worry about accomplishing your project, not setting up and maintaining your Node-RED instance.
Create a FRED Account
To begin our tutorial create your own Node-RED instance in the cloud. Register for a free account at http://fred.sensetecnic.com.
After registering make sure to activate your account via your email. You will not be able to login until you validate your account.
Introduction
In a previous tutorial (post data to dweetio using fred) you learned how to build a simple Node Red flow using Dweetio. This tutorial will teach you how to build a similar Node Red Flow that requests data from a web service and visualizes it; all from FRED.
One of the great advantages of FRED is its great palette of nodes that integrate with different web services. One of such services is OpenWeatherMap, which allows you to access weather data easily.
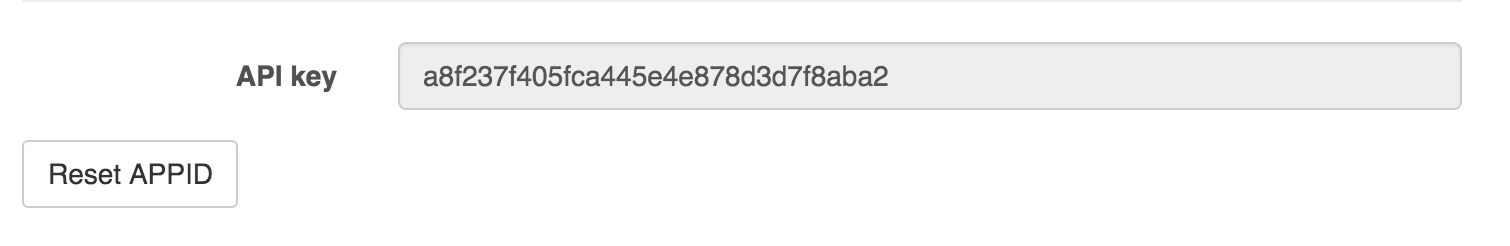
To begin, head over to http://openweathermap.org/ and register for an account. It’s FREE! When you register/login you will be able to access your API Key, we will use this key in Node RED.
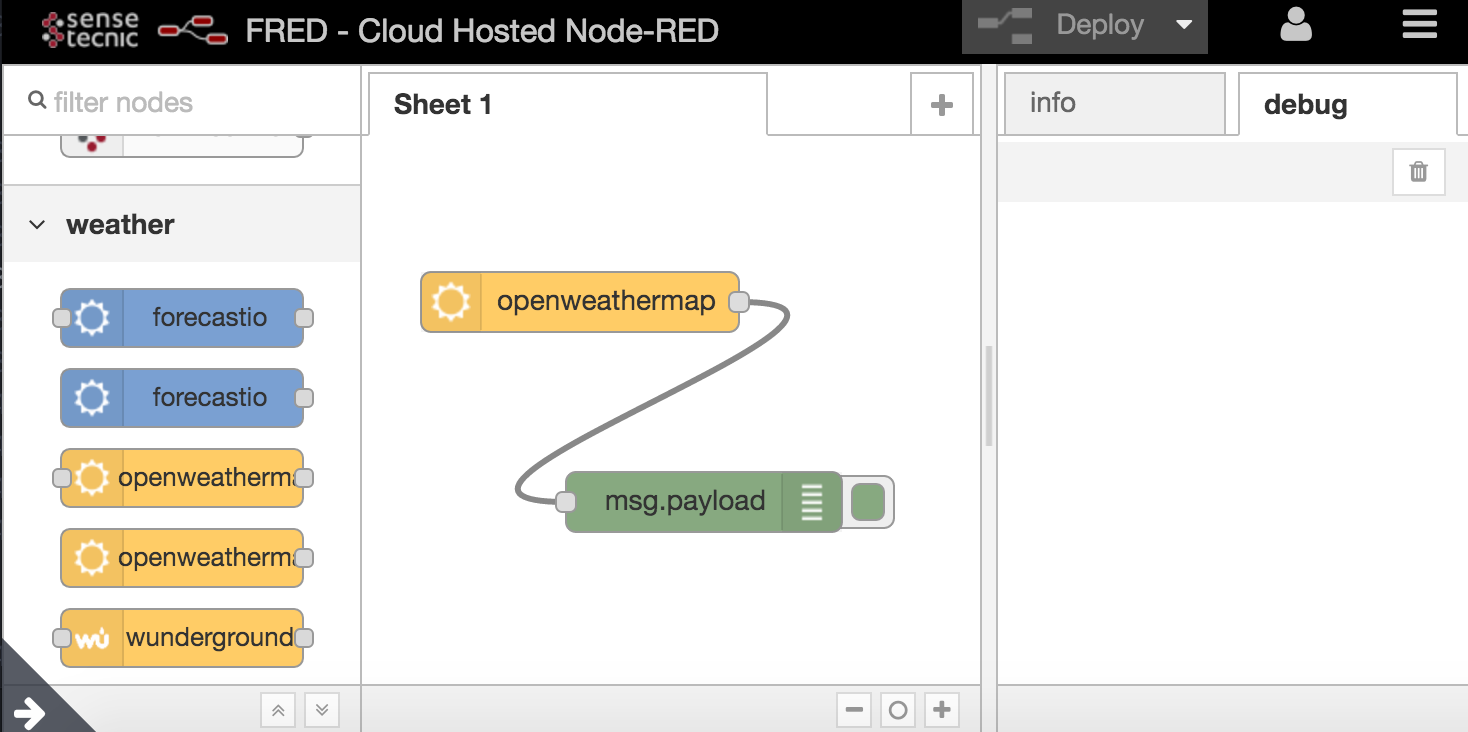
Now, head over to FRED at http://fred.sensetecnic.com. Connect an “openweathermap” (you will find this node under “weather”, or by using “filter nodes” on top of the left pane) node and a debug node like this:
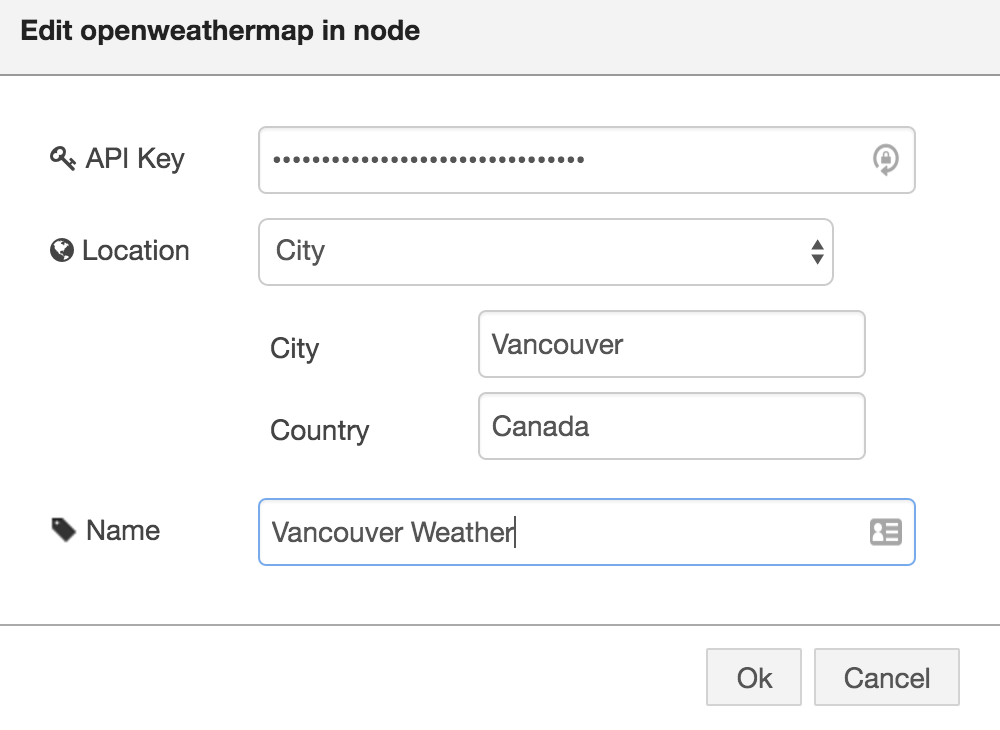
Now, double click on the “openweathermap” node to configure it. Enter your API Key from OpenWeatherMap, configure a location you’re interested in, and name your Node:
Click on “Deploy” on the top right corner. You will see on the right pane, under “debug” the data that OpenWeatherMap provides us with:
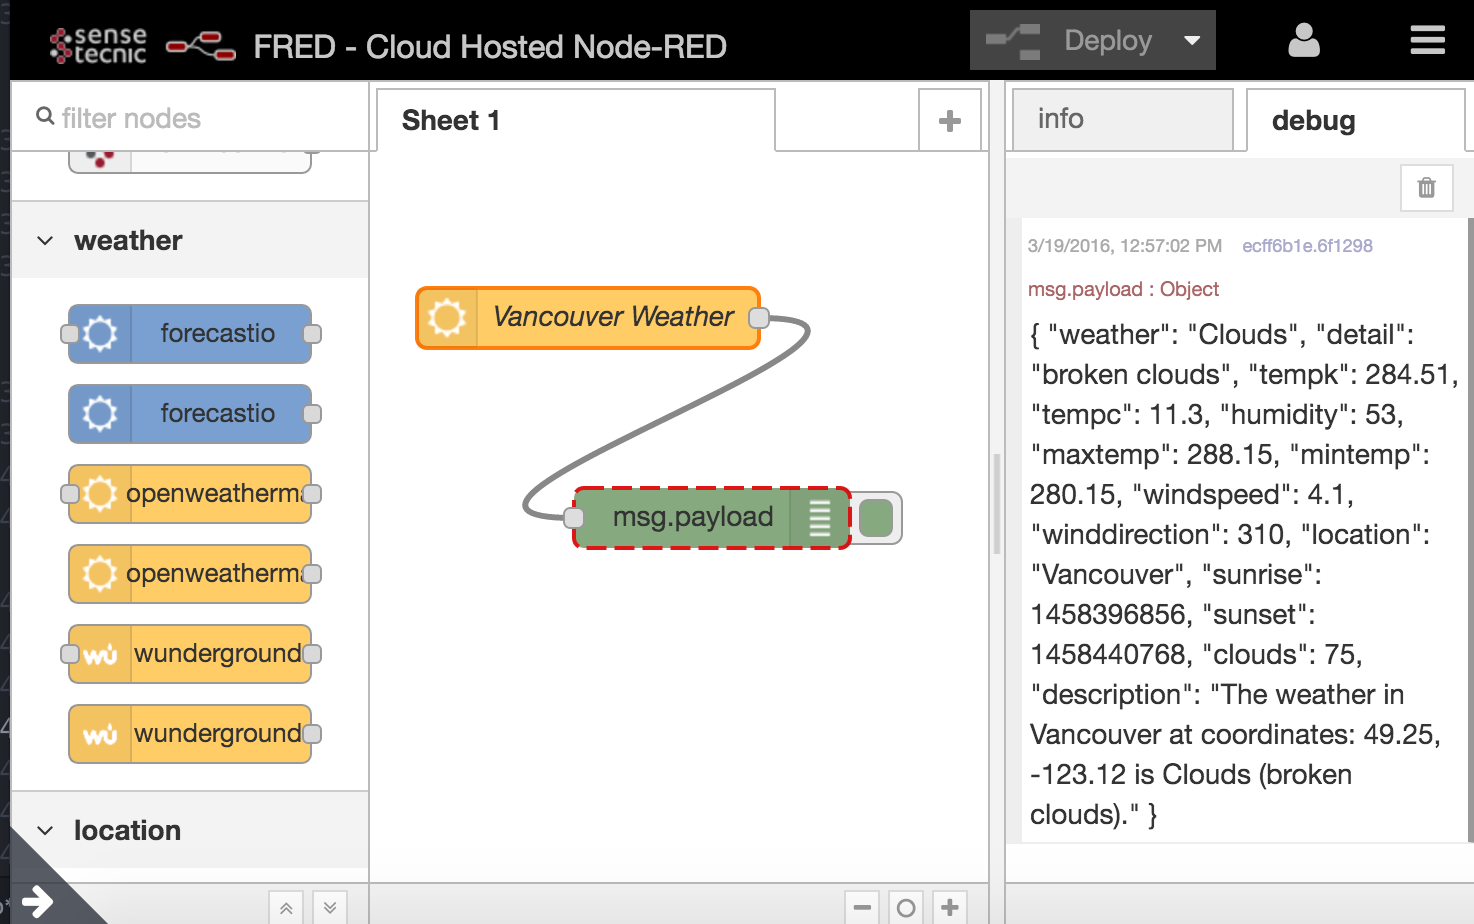
As you can see, the data is already in JSON format; so we can use any of the values very easily. Let’s build a dashboard to visualize our data. Another great node available by default in FRED is the “FreeBoard” node that allows you to create visualizations very easily. Find the “freeboard” node in the left pane by either browsing through the nodes or searching for it using “filter nodes”. Add it to the flow. Double click on it to give it a name, like so.
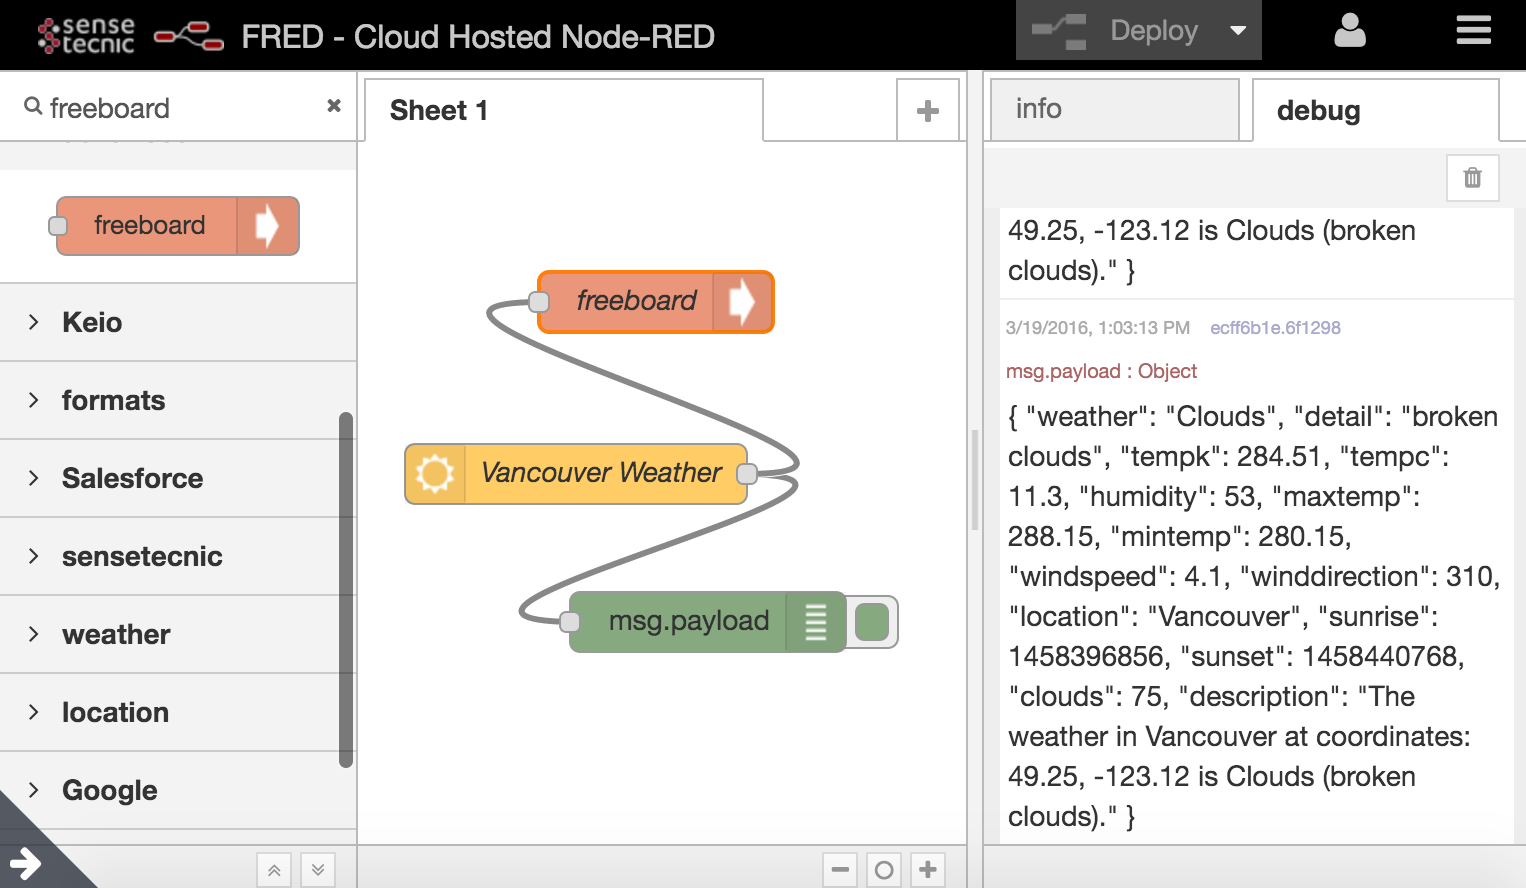
Click on “Deploy”. This will prompt the “openweathermap” to get data and send it to both the “debug” and “freeboard” nodes. This will automatically configure the “freeboard” node. If you inspect the “info” tab in the right panel you will see more information about the “freeboard” node:
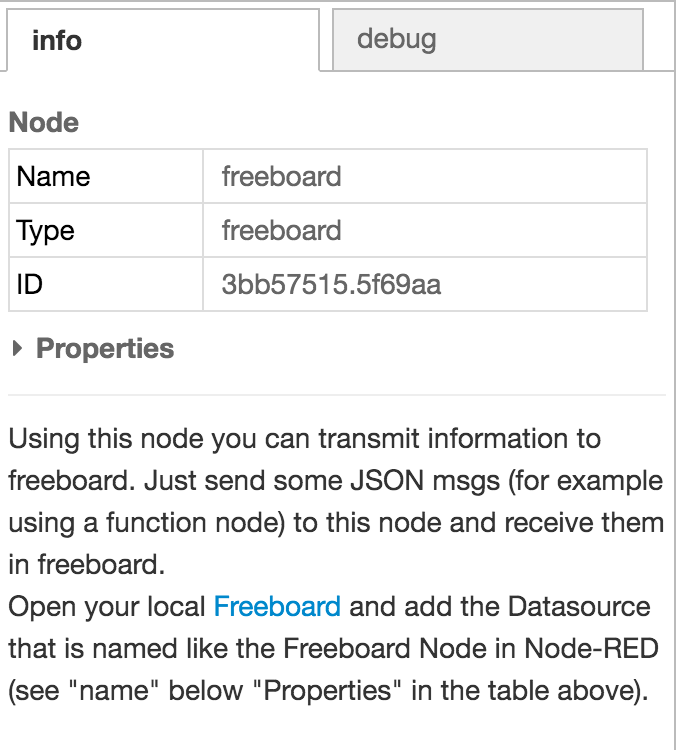
Visit the link provided in the info panel, or click here. This will open a new tab in your browser:
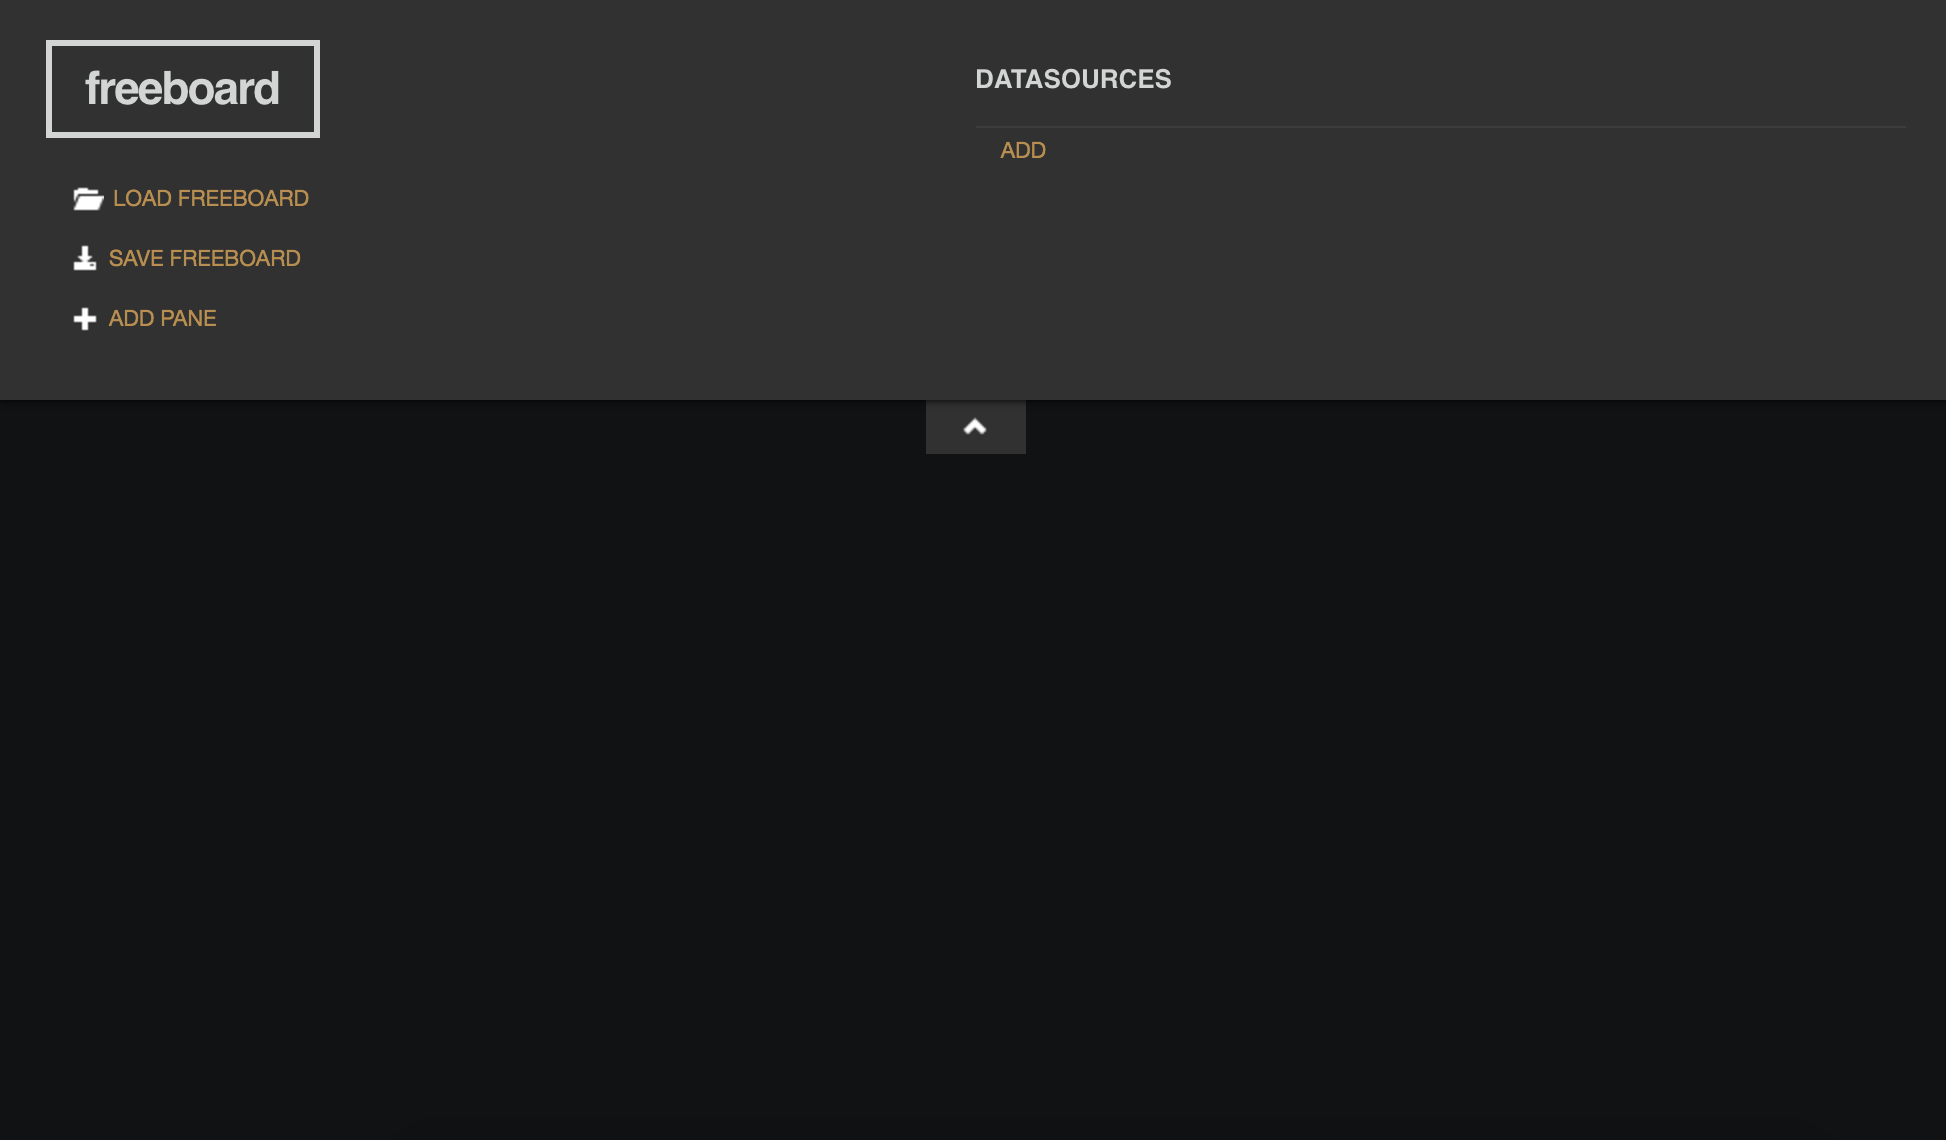
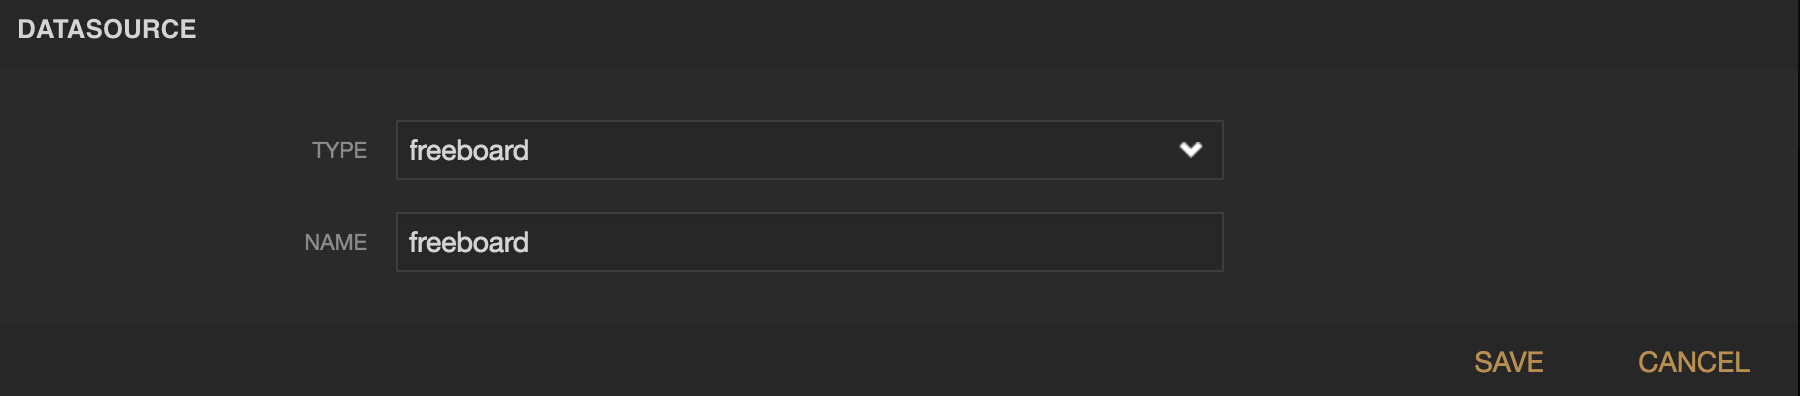
This tab will allow you to create visualization FreeBoards, save them and load them. Let’s create a visualization of our weather data. We first need to add a datasource to our freeboard. Click on “Add” under “DATASOURCES”. Under “type” select the name of the “freeboard” node we configured above. In our case we named it “freeboard”. This will allow us to access ANY data we connect to the “freeboard” node in Node RED.
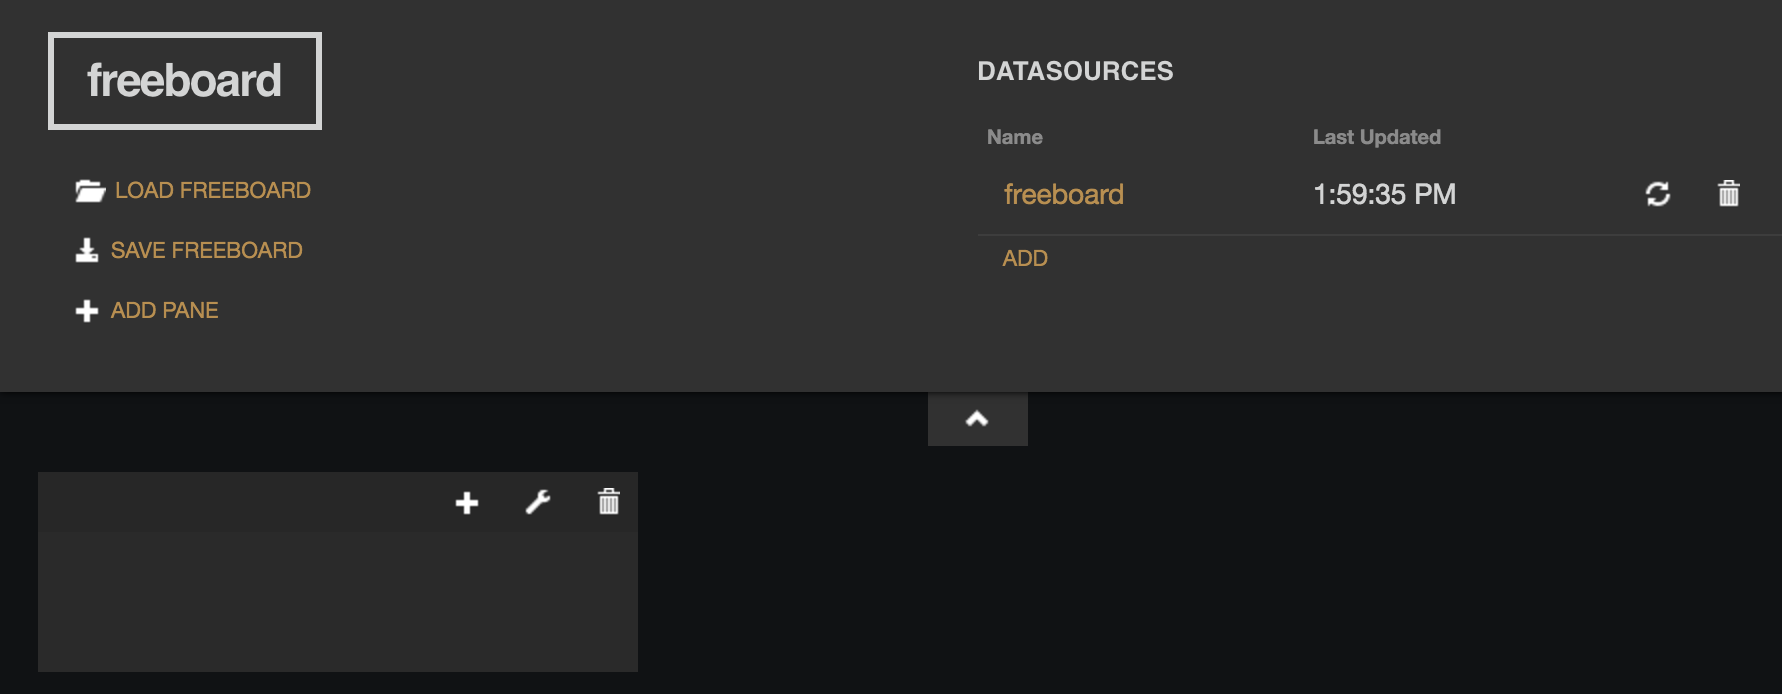
We will now add a Pane. Click on “ADD PANE”, this will add a new empty pane:
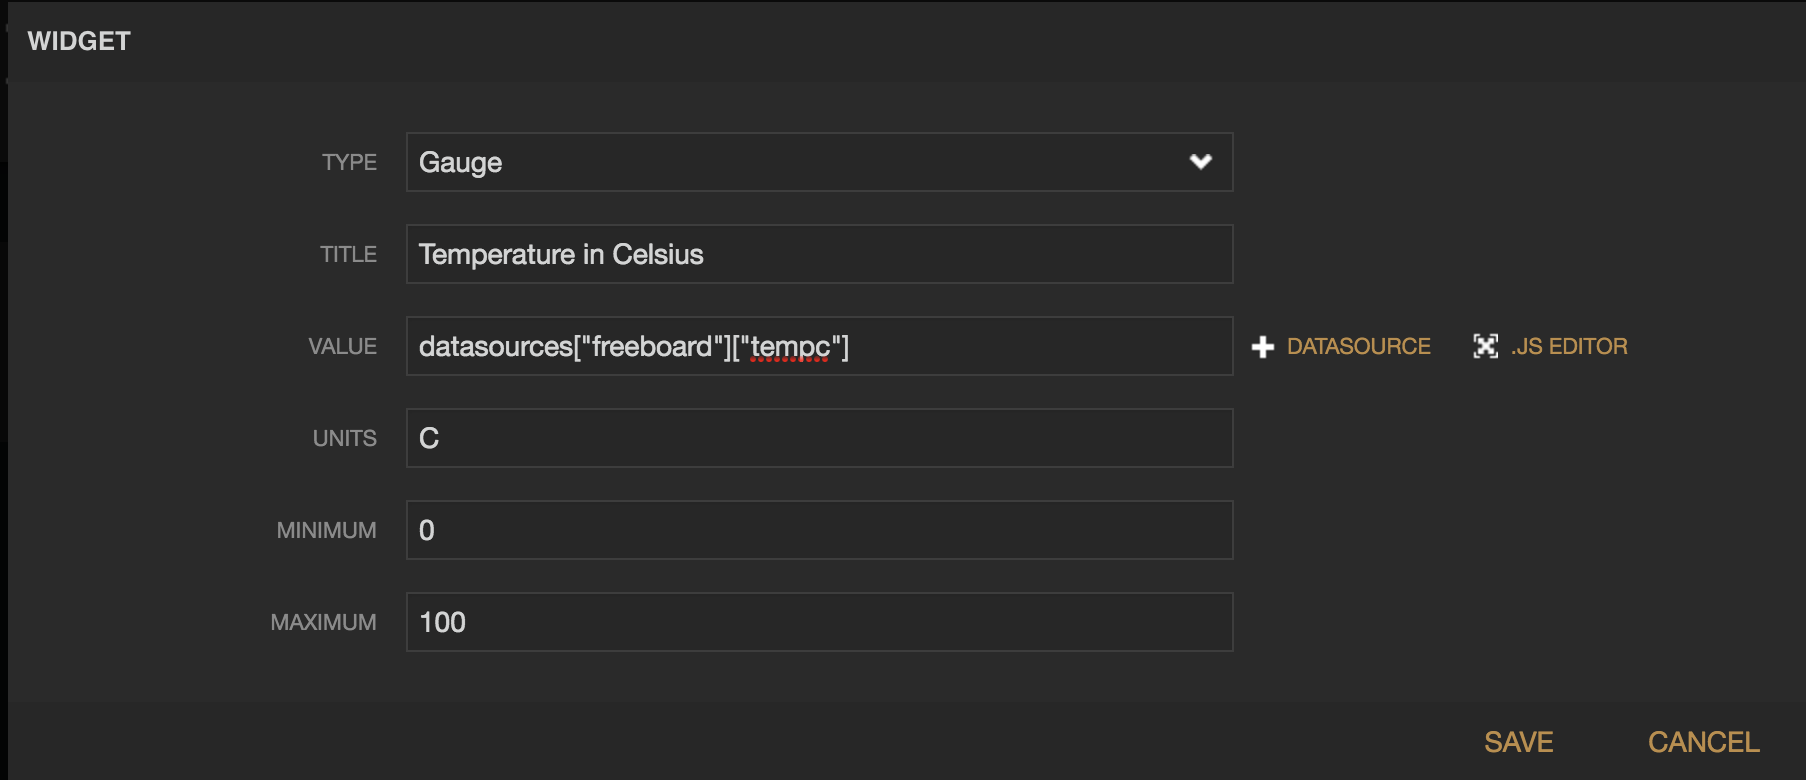
Now, we will add a “Widget”, click on the “+” (plus) sign in the new pane. Select “Gauge”. Under “DATASOURCE” select the “freeboard” node and select “tempc”. If you can’t see this in the dropdown, go back to Node RED and click on “Deploy” again. So that the “freeboard” node can get some data and store the data it has received. Your configuration should look something like this:
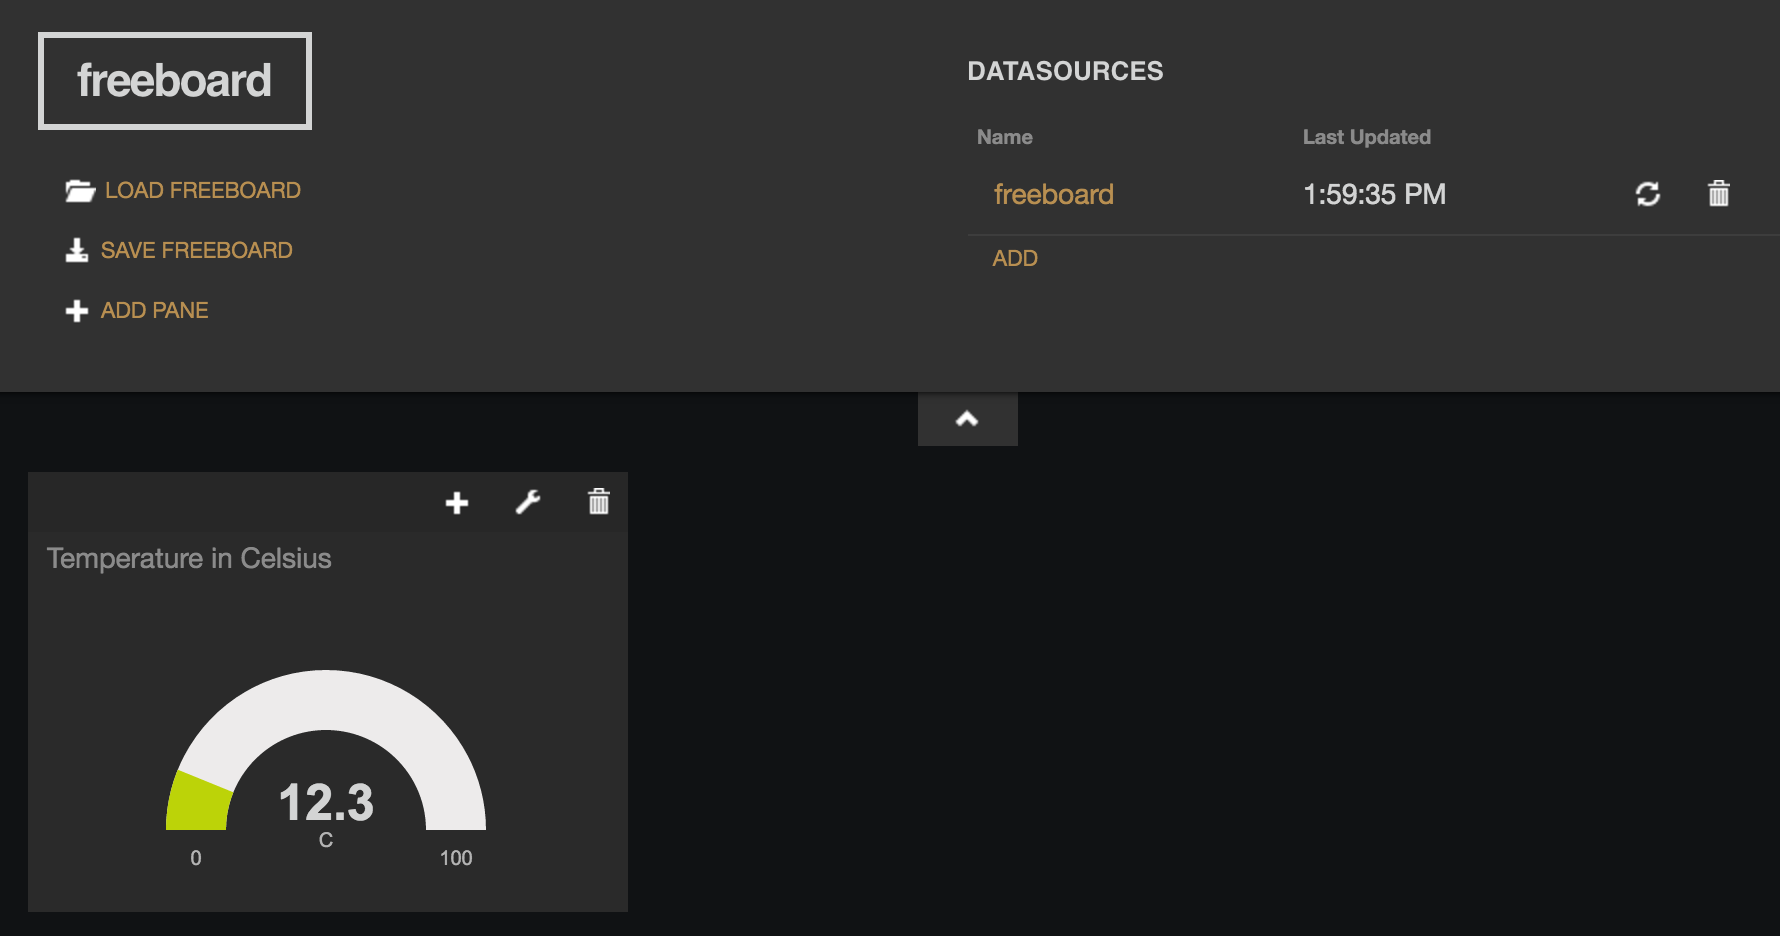
Click on OK. Which will build your widget and add it to the pane you created!
To save your dashboard click on “save” which will save it in FRED. From now on you can access your saved dashboard by accessing the saved url, similar to:
https://{username}.fred.sensetecnic.com/freeboard/
great