
This tutorial shows you how to use FRED — a cloud based Node-RED — to connect to the General Electric’s Predix platform and use the Timeseries microservice. We make use of a new node we’ve created, node-red-contrib-predix-timeseries, on the FRED cloud-hosted Node-RED service.
This tutorial will demonstrate how we can write a Node-RED flow running on the cloud service (FRED) that communicates directly to the Timeseries microservice on Predix. The flow reads and writes timeseries data using the Predix Timeseries nodes we recently released, and shows you how to visualize data from Timeseries using the dashboard nodes. We’ll use these new nodes to ingest data and send query commands to timeseries – all from the cloud!
A tutorial on the dashboard nodes can be found here.
Create a FRED Account
If you don’t already have an account on FRED (Cloud Node-RED), set one up now. It’s free for a demo account, which can be used for these tutorials and any other experiments you may have with Node-RED. Register for a free account at http://fred.sensetecnic.com.
After registering, make sure to activate your account via your email. You will not be able to login until you validate your account.
About the Predix Timeseries Microservice
Predix is a software platform developed by the General Electric, aiming to support the fast growing development of the industrial internet of things with cloud and software applications. Predix Timeseries is one of the microservices available on the Predix platform. This service collects time stamped data elements over a continuous period of time, which is efficiently indexed for quick retrieval. More information of the Predix Timeseries can be found on the Predix Developer document.
About Sense Tecnic: Sense Tecnic Systems Inc have been building IoT applications and services since 2010. We provide FRED, cloud hosted Node-RED as a service to the community. We also offer a commercial version to our customers, as well as professional services. Learn more.
Prerequisites
Before getting started, you should have done the following.
- If you don’t already have a free FRED account, set one up
- If you don’t already have a Predix developer account, set one up on Predix Developer Network.
- If you don’t have a Timeseries instance on the Predix platform yet, follow our quick setup guide to setup an instance of the Timeseries microservice.
Once this is done the rest of the tutorial will show you how to do the following.
- Install the Predix Timeseries node on your FRED instance
- Use the timeseries ingest node to ingest data to your timeseries instance
- Use the timeseries query node to query data from your timeseries instance
- Create a dashboard to visualize the latest data from your timeseries instance
Installing Predix Timeseries node
First, login with your free FRED account. Once you have signed in, find the “Add or Remove Nodes” button at the sidebar. From here, you can search for predix-timeseries node by typing in the name.
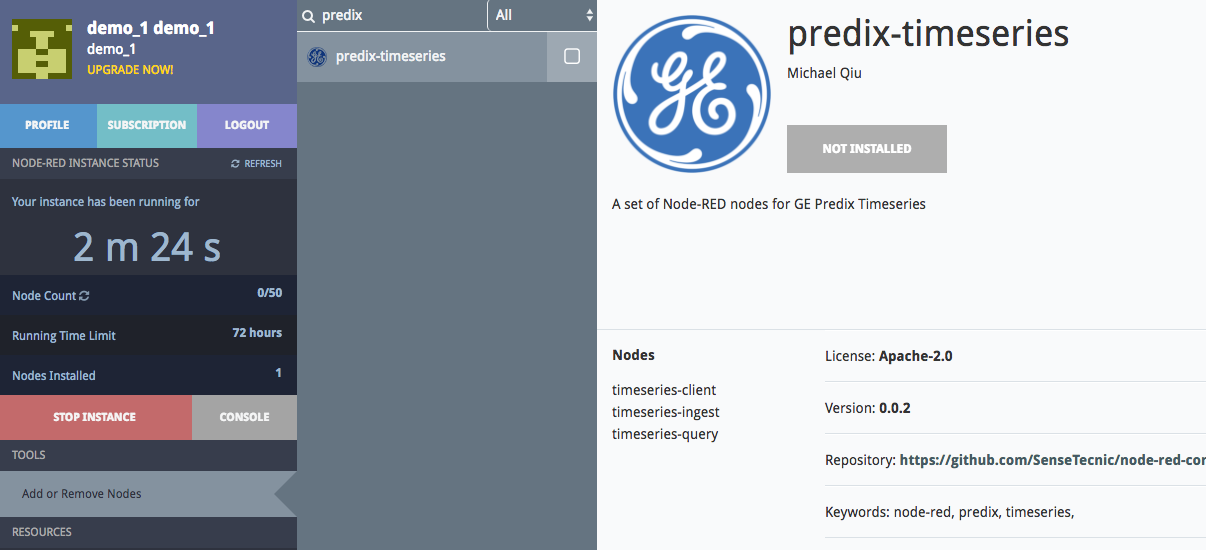
If you have not yet installed the node, click the button below the node name to install the node. You will also need to restart your instance if your instance was already running when you installed the nodes.
Start your FRED instance. You should see the Predix Timeseries nodes listed in the nodes palette under storage.
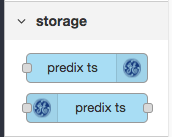
As you can see, we have provided 2 new nodes to interface to Predix Timeseries. The timeseries ingest node ingests data to Predix Timeseries. The timeseries query node sends query commands to Predix Timeseries and returns data in the output.
Using the timeseries ingest node
The timeseries ingest node takes the incoming messages and sends it off to the configured timeseries instance on Predix. Before you start, make sure you have followed the quick setup guide to setup a functional timeseries instance on Predix, and you have access to the timeseries instance to find out required credentials.
We start by dragging the timeseries ingest node onto the editor. Double click the node and select the config tab.
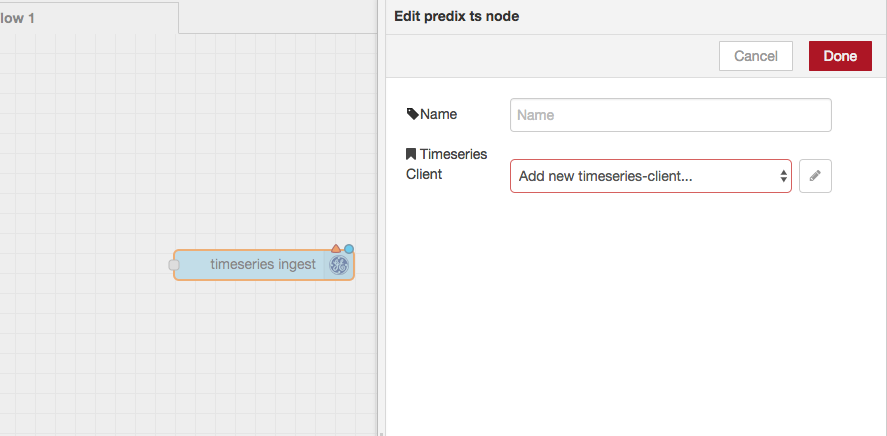
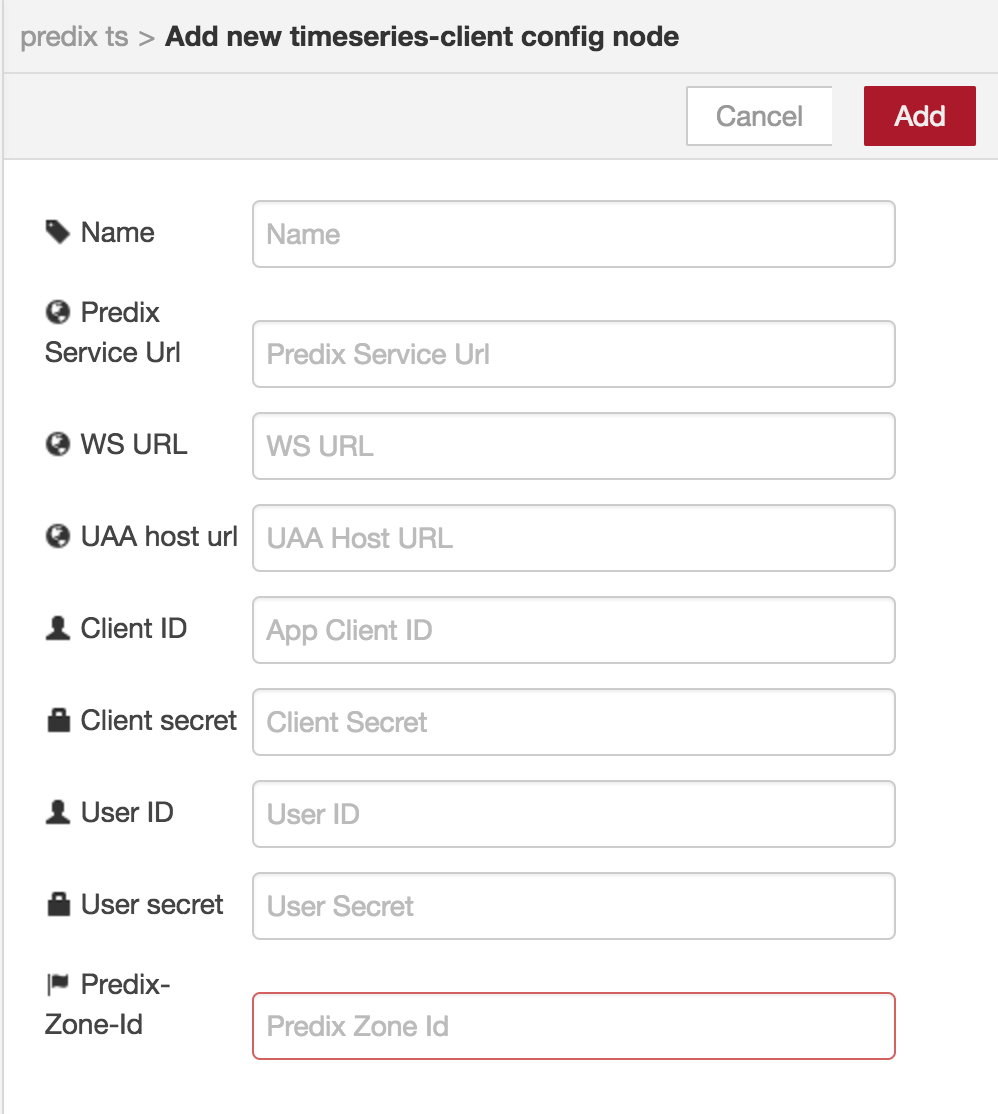
Click on the button beside Timeseries Client to add new timeseries-client, and you will be prompted to enter the details of your timeseries instance. Again, if you are not sure where to find this information, please refer to the quick setup guide.
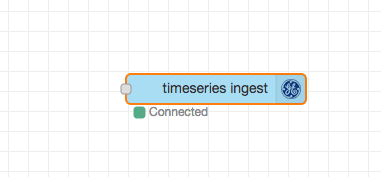
Once you have all the correct information and have deployed the flow, you should see the node indicates that it is authenticated and is connected to timeseries.
Now we will show you a simple example to ingest data. We will drag an inject node, change node, random node and a function node onto the editor and wire them to the timeseries ingest node.
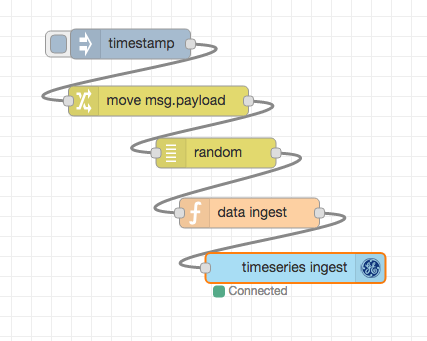
In this sample, we are generating a random number as the measurement data to ingest into timeseries via msg.payload. You can replace this random node with actual data input node to fit your actual use.
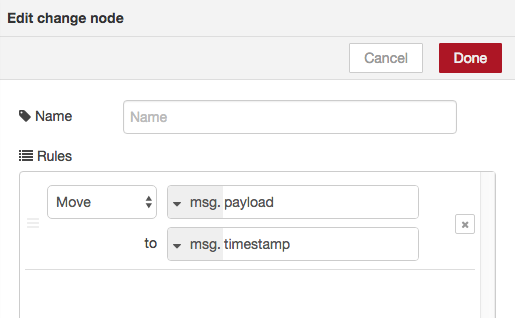
We use the change node to move the timestamp from msg.payload to msg.timestamp, so the timestamp can be used later on in the same flow.
Inside the function node, we enter this code
var newMsg = {
    payload: {
        "messageId": msg.timestamp, // In this case, we are using the timestamp as the message ID
        "body": [
            {
                "name": "demoData", // The tag name that we are ingesting
                "datapoints": [
                    [
                        msg.timestamp, // Timestamp
                        msg.payload, // Measurement, in this case the random number generated
                        3 // Quality of measurement
                    ]
                 ],
                 "attributes": {
                     "host": "server1", // Customized attributes of datapoints
                     "site": "Vancouver"
                 }
             }
        ]
   }
}
return newMsg;
In this example, we use Epoch timestamp for “messageId” and the timestamp in the datapoints (the timestamp was generated from the inject node, and is sent to timeseries ingest node in msg.timestamp). For this sample, we generate random numbers ranging from 0 to 100 as the measurement data (by using the random node). The last integer “3” is the quality of the data. For more information of this message body, please refer to the Predix developer document.
NOTE: Once you deploy this flow, you will be able to ingest a random number into Predix Timeseries by clicking the inject node. Later, you can always replace the random generated number with other meaningful data, such as sensor readings. This random number generated in “datapoints” is just a placeholder for this tutorial. You can also set the inject node to repeat the ingestion process at a user defined time interval by setting the repeat option.
Using the timeseries query node
In this part we will show you a few different usages of the timeseries query node. First drag the node onto the editor. By double clicking the node, you will be shown the configuration dialog as shown.
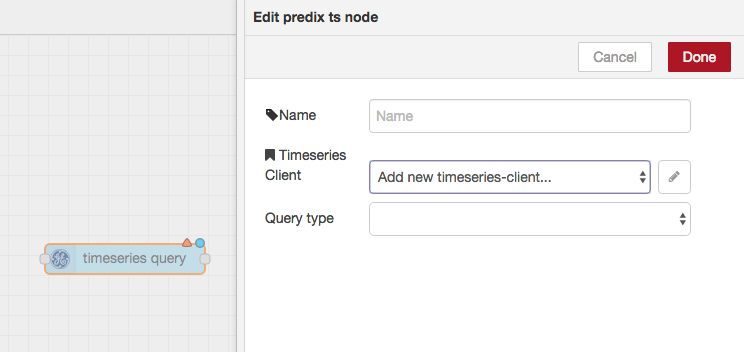
For the timeseries query node, you will need to configure the timeseries client just as you did for the timeseries ingest node.
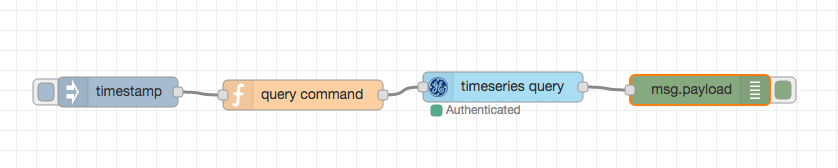
Then, to setup a timeseries query, we will need an inject node to trigger the query, and also a function node to send the query command. The query command will be different for each usage. So the general flow setup will look like this:
By selecting the query type, users will be able to hit different endpoints of the Predix Timeseries API.
They are:
- Get all available aggregations
- Query datapoints
- Query for the latest value
- Get all tags
Next, we will show some sample usages with these query types.
Get all available aggregations:
To get all available aggregations, you would need to select “Get all available aggregations” in the dropdown menu of query type in the timeseries query node.
For this option, we don’t have to send any specific content to the timeseries query node. Users can just wire an inject node to the timeseries query node directly to trigger the query action.
Query Datapoints
Users can use this option to query datapoints and perform actions with the query action. Just select “query datapoints” in the dropdown menu of query type. Here we have sample query commands to show you some different usages of the this endpoint. Just enter these query commands in the function node and you are good to go.
Here are some sample queries:
Grouping datapoints
msg.payload={
  "start": "1y-ago",
  "tags": [
    {
      "name": "demoData",
      "order": "desc",
      "groups": [
        {
          "name": "quality" // "quality" is one of the groups options in timeseries
        }
      ]
    }
  ]
};
return msg;
Using this piece of code, the timeseries query node will return datapoints starting from 1 year ago where the tag name is “demoData”, in descending order, grouped by the quality field.
Datapoints on Predix can be grouped in different ways, such as:
- by quality
- by attributes
- by measurement
- by time
For detail usages of these groups options, pleasure refer to the Predix Timeseries document.
Query a limited number of datapoints
Using this piece of code, the timeseries query node will return datapoints starting from 1 year ago where the tag name is “demoData”, in descending order and limited to 50 datapoints.
msg.payload={
  "start": "1y-ago",
  "tags": [
    {
      "name": "demoData",
      "order": "desc",
      "limit": 50
    }
  ]
};
return msg;
Query time-bounded datapoints:
Using this piece of code, the timeseries query node will return datapoints that is bounded within the start and end Epoch time period in descending order.
msg.payload={
  "cache_time": 0,
  "tags": [
    {
      "name": "demoData",
      "order": "desc"
    }
  ],
  "start": 1452112200000,
  "end": 1453458896222
};
return msg;
Users can also use relative-time to query. For example, users can use a string “15mi-ago” to represent a value of “15” and a unit of “minutes”.
Query with aggregation request:
Using this piece of code, the timeseries query node queries for the average value with a 30-second interval on which to aggregate the data.
msg.payload={ "tags": [ { "name": "demoData", "aggregations": [ { "type": "avg", "sampling": { "unit": "seconds", "value": "30" } } ] } ], "start": 1452112200000, "end": 1478738637279 };
return msg;
For detail usages of data aggregations, pleasure refer to the Predix Timeseries document.
Query for the latest value
This option will query the latest datapoint values with the specified tag name. To hit this endpoint, just simply select “query for current value” in the query type dropdown menu.
Then, we will use this code in the function node:
msg.payload={
  "tags": [
    {
      "name": "demoData"
    }
  ]
};
return msg;
which simply specifies the tag name of the datapoint that we would like to query.
Get all tags:
This option will query all the tag names within the timeseries. To use this option, select “Get all tags” in the query type dropdown menu.
For this option, we don’t have to send any specific content to the timeseries query node. Users can just wire an inject node to the timeseries query node directly to trigger the query action.
Visualizing recent data with the dashboard
In this final section we will show a quick demo on how to use the dashboard nodes on FRED to visualize recent data values from the timeseries
If you are not familiar with the dashboard node already, please refer to our previous tutorial.
Here is the setup of the flow:
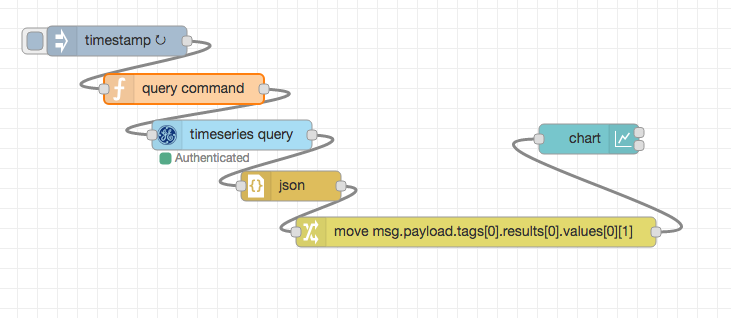
As you can see, we have the timeseries query node and the query command function node setup to query the latest values (See previous examples). We use a json node to parse the results from the timeseries query node, and use a change node to move the measurement data into the msg.payload field. This is how we set up the change node:

As you can see from the previous screenshot, we are moving
msg.payload.tags[0].results[0].values[0][1]
to msg.payload. This works when we only query the latest value from one tag name. If you are querying for multiple tag names, the output structure might be different.
Also, you can setup the inject node to inject query in a set time interval to continuously retrieving the latest data value from timeseries.
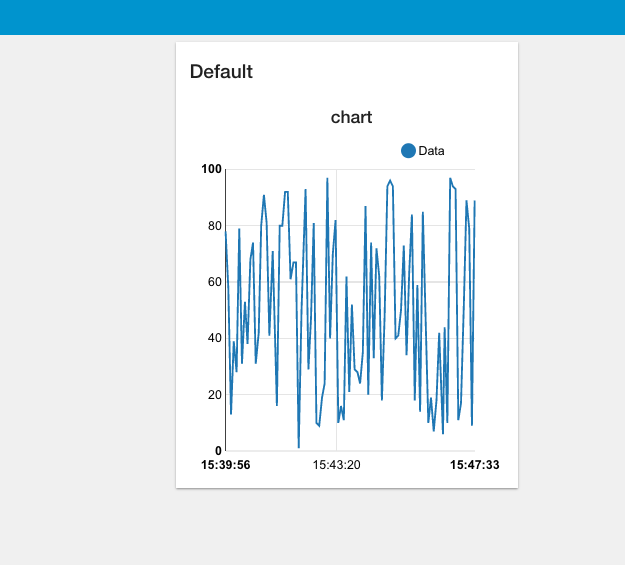
You will see the output chart with some graph like this:
Now you’ve got the basics sorted out, play around with the different usages of these nodes to manipulate the real world data! – have fun!