
OPC Unified Architecture (OPC UA) is a popular machine-to-machine communication protocol in industrial automation. It is a sophisticated, scalable and flexible mechanism for establishing secure connections between clients and servers. FRED is a Cloud-hosted Node-RED platform that can be used to provide an easy and reliable solution to process and monitor data from your OPC UA server. This tutorial will be focusing on how to send data from a local OPC UA server to FRED using node-red-contrib-opcua, the STS-MQTT platform, and how we can further process the data using FRED.
You can find the sample code for this tutorial here.
Create a FRED Account
If you don’t already have an account on FRED (Cloud Node-RED) set one up now. Demo accounts are free and can be used for these tutorials and any other experiments you may have with Node-RED. Register for a free account at https://fred.sensetecnic.com.
After registering, make sure to activate your account via your email. You will not be able to log in until you validate your account.
About OPC-UA
The OPC Unified Architecture is a secure, open, reliable mechanism for transferring information between servers and clients. It is widely used in industrial automation applications. OPC UA extends the highly successful OPC communication protocol, enabling data acquisition and information modeling and communication between the plant floor and the enterprise reliably and securely.
Prerequisites for this tutorial
To follow this tutorial you must have the following:
- Access to an OPC UA server, or able to set up a server on a Windows OS.
- Download and install KEPServerEX and QuickOPC on your Windows.
- An activated FRED account.
- Node-RED installed and running on a Windows PC. You can refer to the Node-RED installation documentation for more information.
- Set up your STS-MQTT service on mqtt.sensetecnic.com. You might also want to go through this tutorial about STS-MQTT first.
- You need to install the “dashboard” node on your FRED instance. You can do this by installing in “Add or Remove nodes” menu.
Overview of steps in the tutorial
- Setup and config an OPC UA server on your Windows PC.
- Configure Node-RED to send data to FRED.
- Visualize and monitor data on FRED.
Setup the OPC server on your Windows PC
In this tutorial, we will show you how to setup a local OPC UA server on your Windows PC to run this tutorial.
First, you need to download the KEPServerEX. We used the demo version for this tutorial on Windows.
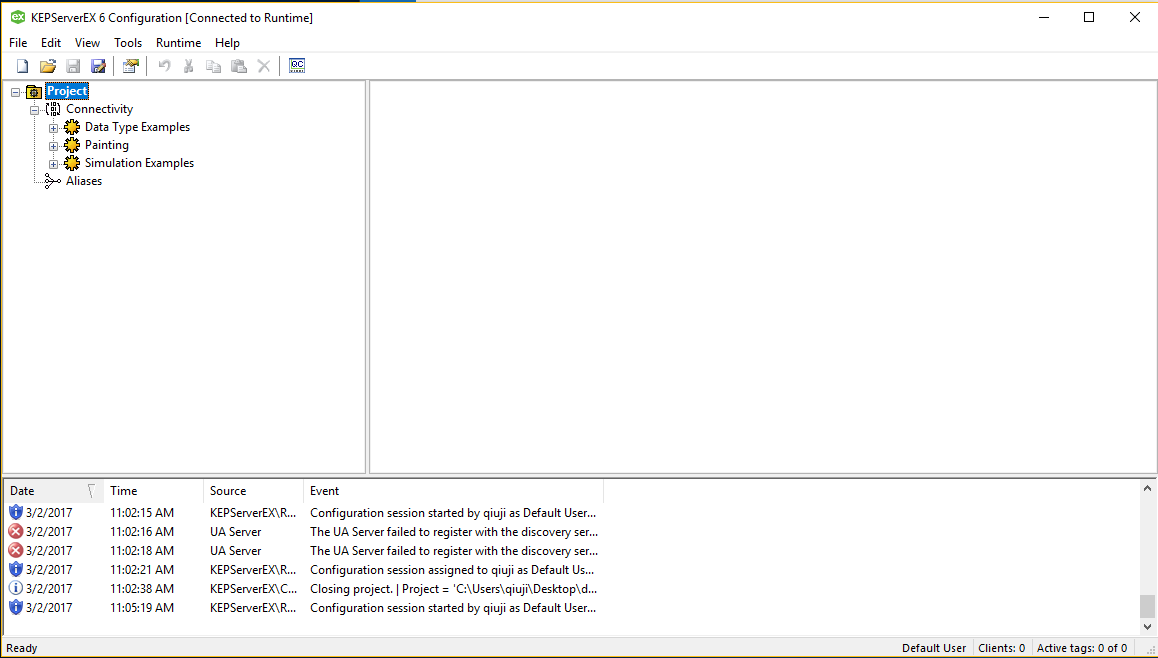
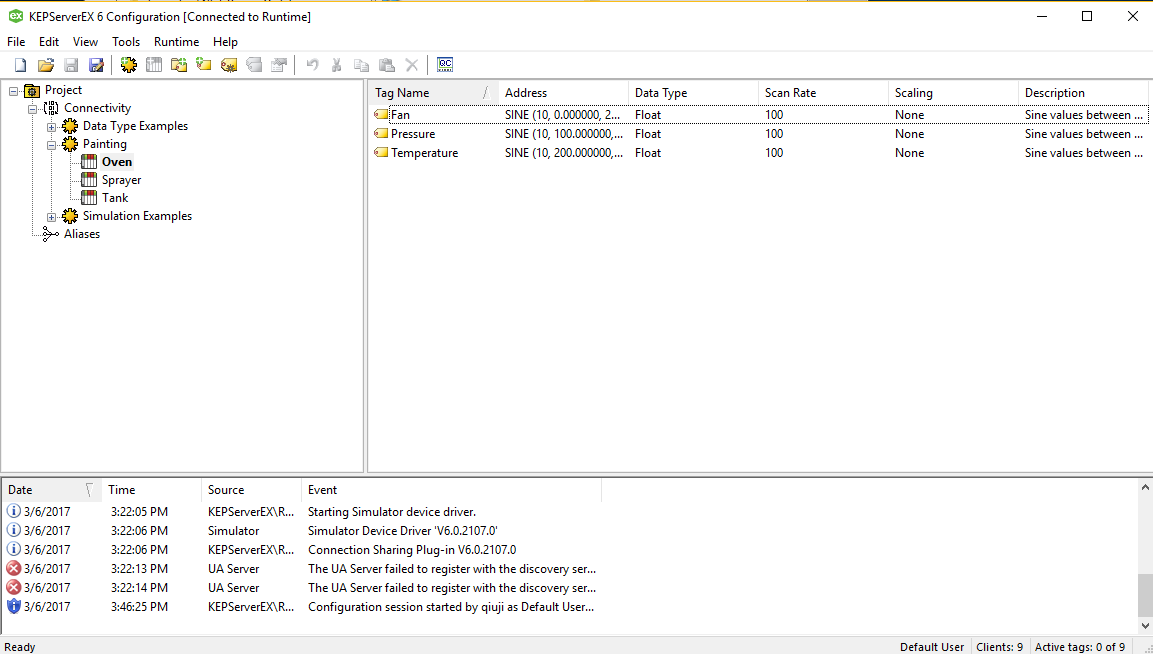
Then, you can import the sample OPC file, named “OPC Painting Demo.opf” provided in our sample code from our github repo. Simply download the sample code. Start KEPServerEX Configuration from the Windows Start menu, and click File -> Open to open the OPC Painting Demo.opf file you just downloaded. You should see the sample OPC application loaded in your KepServerEx system.
To start the OPC server, click Tools -> Launch OPC Quick Client. This window should appear:
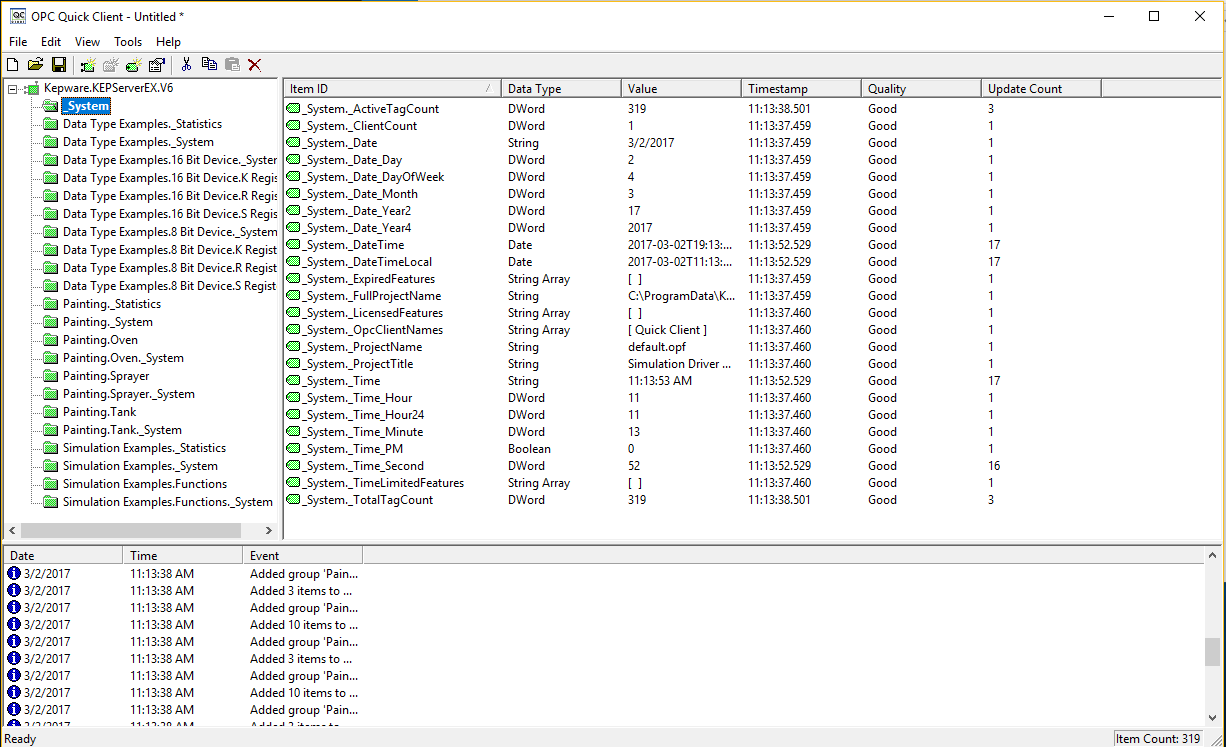
If you click on the details of these data items, you should see how some data is changing continuously. Now you have your local OPC UA server running!
Before we move to the next step, we still need to gather some information. Start OPC UA Configuration in your Start menu, and you should see a window like this:
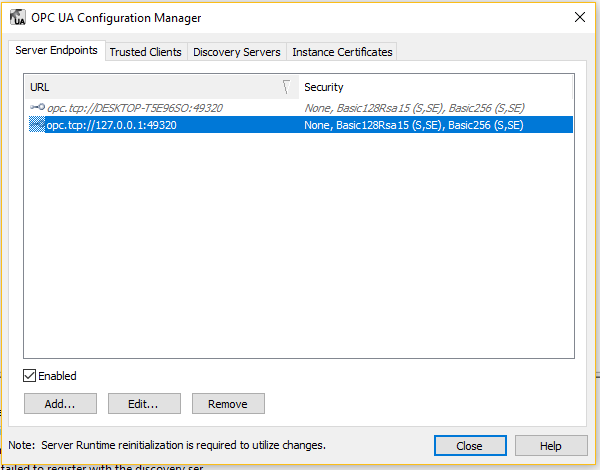
In our case, our OPC-UA server endpoint will be the one that is highlighted.
Next, we will use another tool called QuickOPC. This toolkit will help us gather some more information we need.
Once you’ve setup this software, start it from the start menu or the desktop icon.
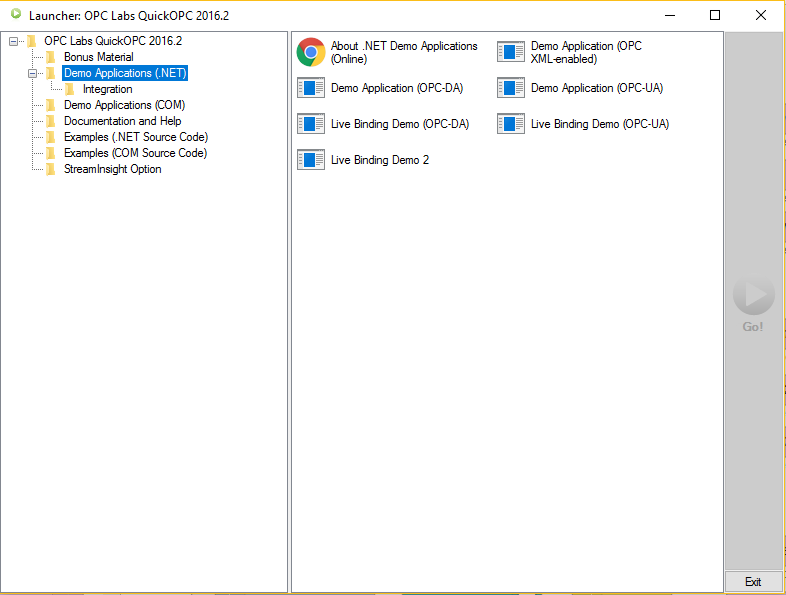
We want to use the Demo Application(OPC-UA) in Demo Applications(.NET). So just double click on that,
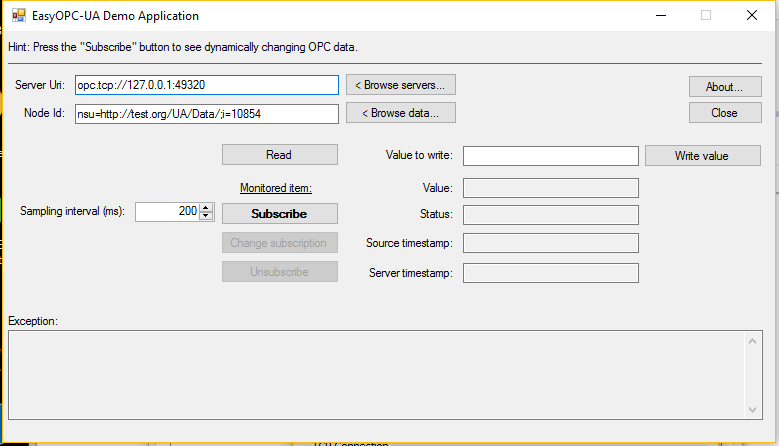
In the Server Url, change the address to your local OPC UA endpoint, and click Browse data.
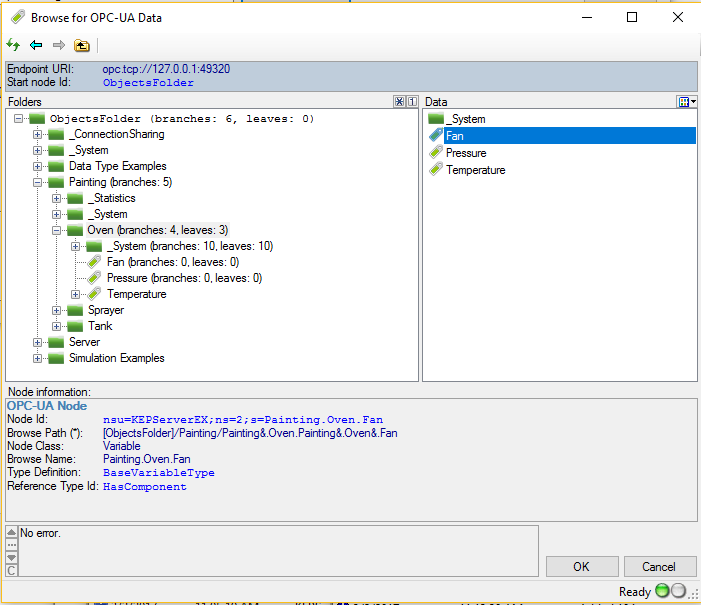
If all configuration is correct so far, you should see a window that you can browse the data in the OPC server. When you click on a specific data item, you should also be able to see the node information in the bottom part of the window. We will need to use this information in the next part.
Configure Node-RED to send data to FRED
First, you will need to run Node-RED on Windows. You can simply run the following command from the same directory you ran npm install node-red in, or that you extracted the release zip file:
node node_modules/node-red/red.jsThen, open your browser and enter http://localhost:1880 to enter the editor of your local Node-RED.
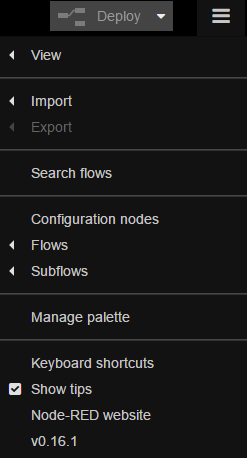
You will need to install node-red-contrib-opcua in your Node-RED. The easiest way would be clicking “Manage palette” from the config menu at the top right corner.
Then, you will see a node palette management side-bar on the left-hand side of the editor. Click the Install tab, and search for “node-red-contrib-opcua”:
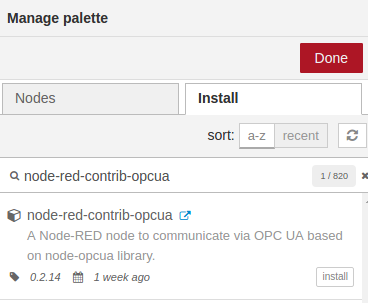
Simply click the install button. Once the installation finishes, you can click “Done” to close the palette management side-bar. You should see these nodes if the installation succeeds.
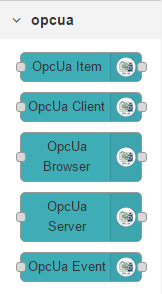
We can first start with the Oven.Temperature. Let’s first drag an OPCUA Client node onto the editor, and in the config tab, we set
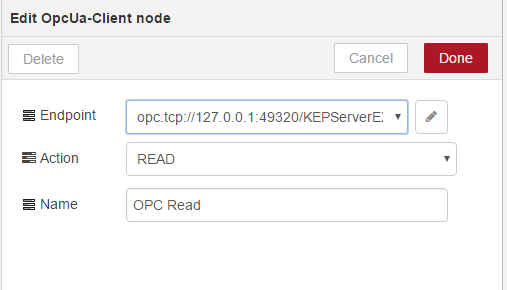
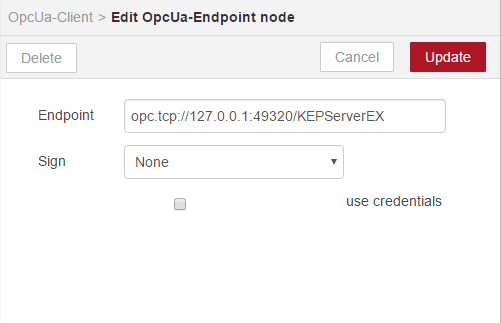
and in the Endpoint, we enter the local OPC endpoint we got from the previous section. You will also need to add “/KEPServerEX” at the end.
Then, let’s drag an inject node in front of the OPCUA client node, and we will set up the inject node like this
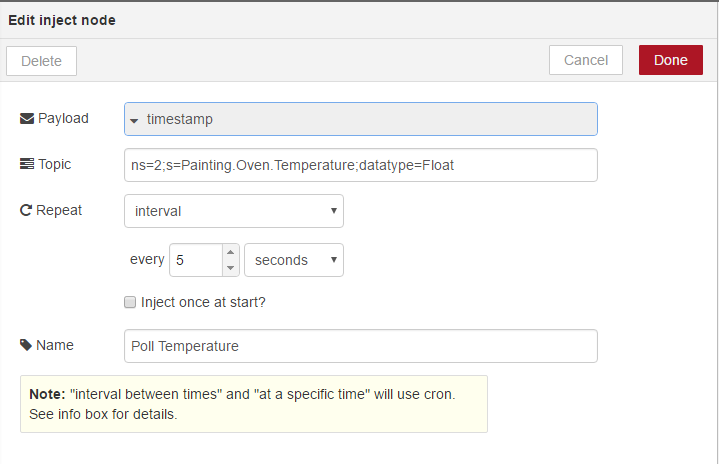
As you can see, we set the inject node to poll data every 5 seconds. We also need to set the topic field with the information we get from the node information we saw in the previous section. You should follow the format how it starts with “ns=xxx”, and also add the datatype corresponding to the data you are getting.
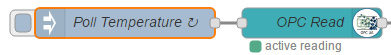
If you deploy the flow now, you should get this
We need to prepare to send data to FRED via the STS-MQTT platform. You can refer to this tutorial for more detail on the STS-MQTT platform.
Here are sample screenshots of our clients and topics setup for this tutorial. We have setup 2 clients and 9 topics.

Two clients, one for the local Node-RED running on Windows, and one on FRED
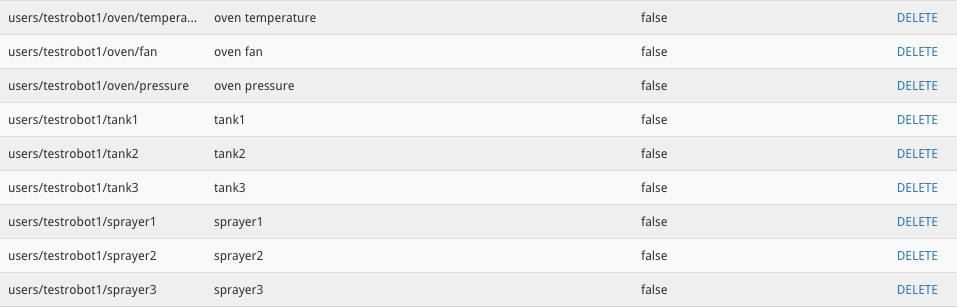
We have set up 9 topics here, each one corresponds to one data source from our OPC server.
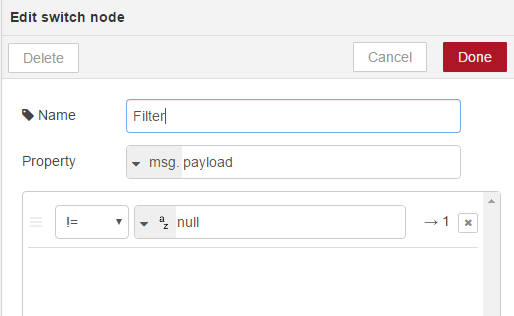
Now let’s go back to our Node-RED editor. We first use a change node to set a filter. If the OPC returns a null data message we will ignore it.
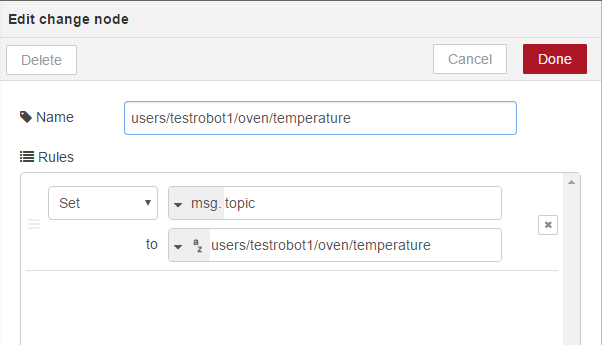
then we will add another change node to set the msg.topic to the correct MQTT topic that we are sending to
For example, for the over temperature, we will have
You can verify your flow with a debug node at the end. Your flow on the editor should look like this
![]()
And you should see data coming in the debug node.
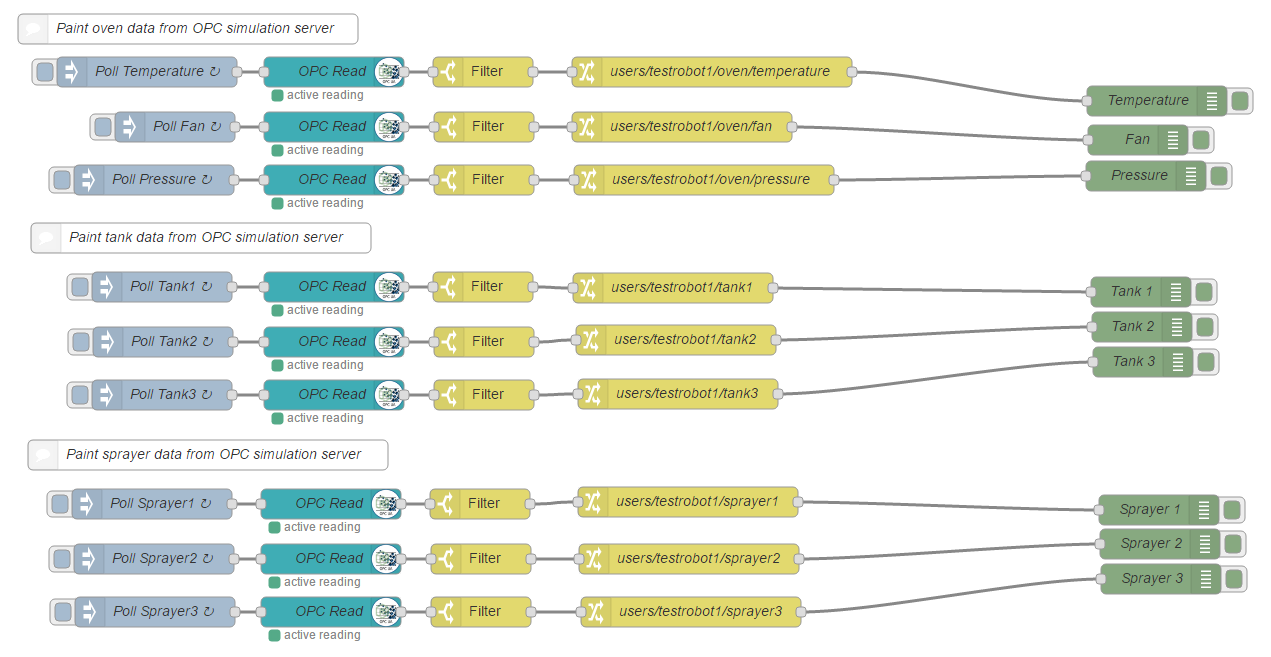
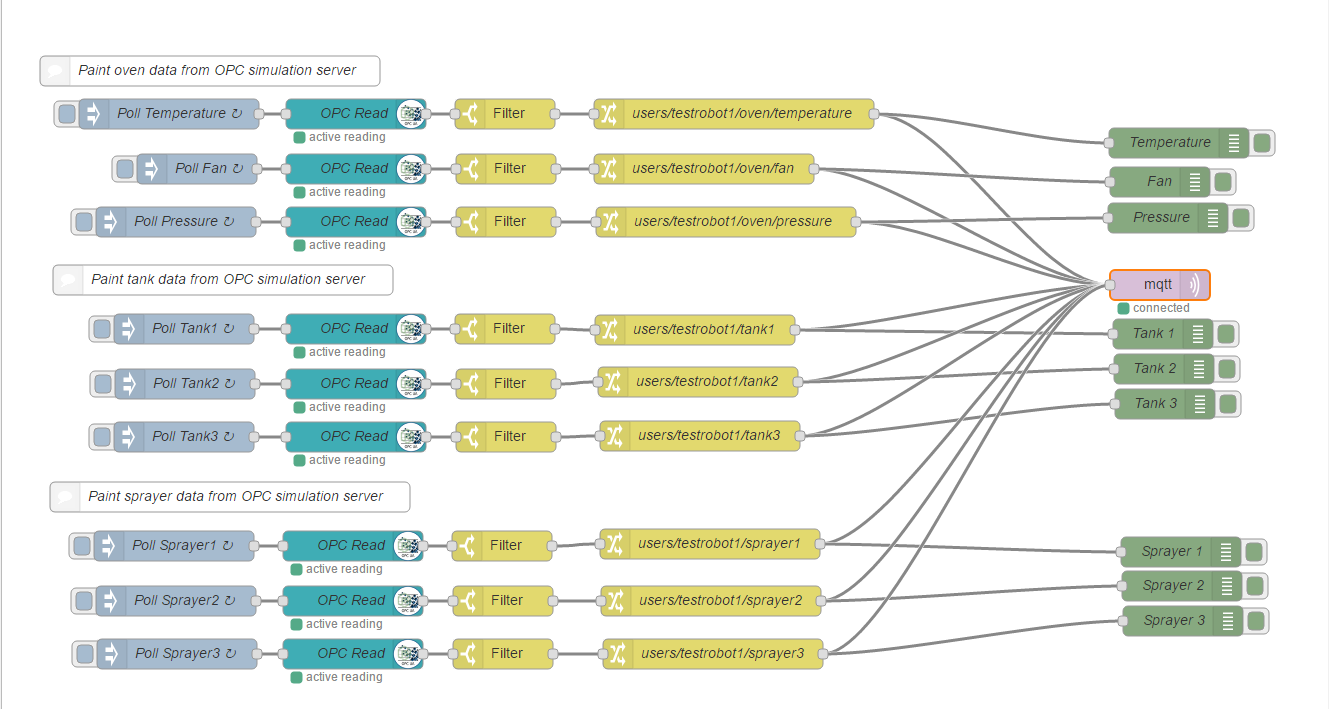
Now, perform the same steps to the other 8 data sources, you will have something like this.
Now let’s add an MQTT out node. We want to send data to STS-MQTT platform, so we drag a mqtt out node onto the editor, and config the node like this
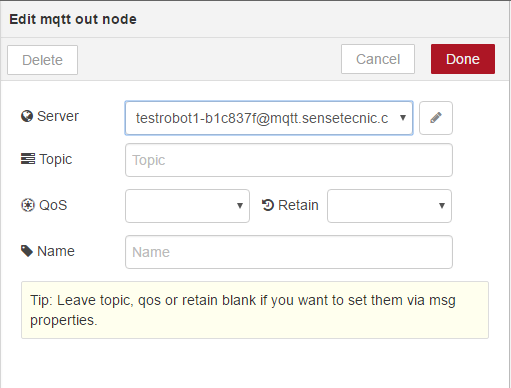
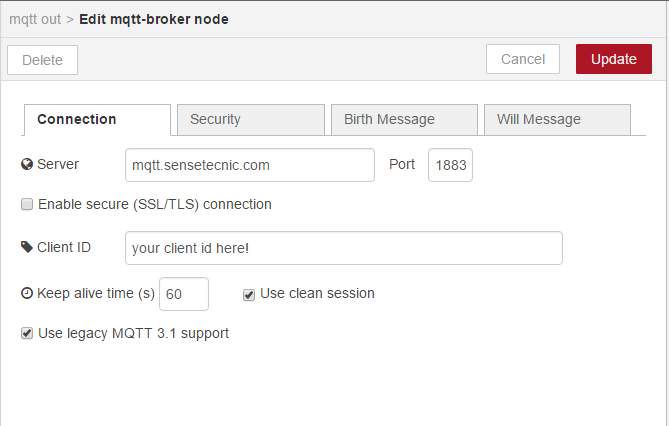
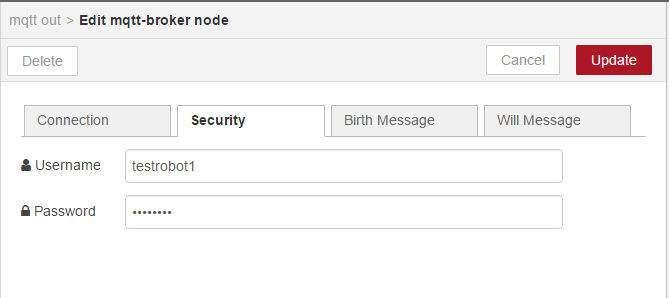
Note: you will need to replace the username, Client ID, Client Key with your actual info on your STS-MQTT platform.
Once you finish, you can connect all flows to the mqtt out node. The flows on the editor should look like this.
You can verify if data is coming through by visiting the STS-MQTT dashboard, and subscribe to the topics that you have connected to
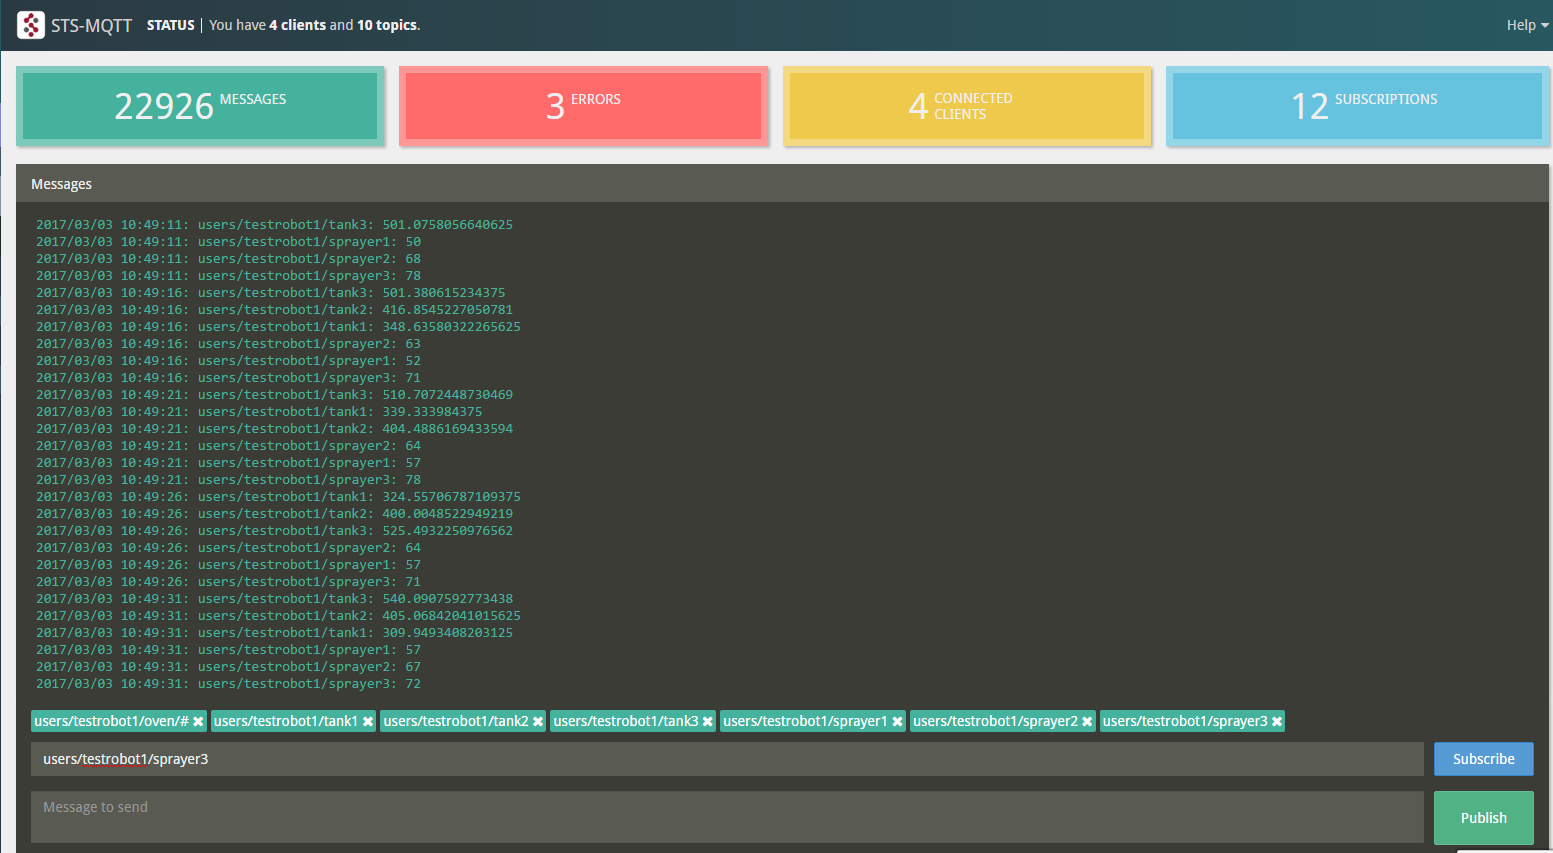
So we can see the data is sending into these topics.
Visualize and process data on FRED
Now that you have data coming into STS-MQTT, you can get the data on FRED and process the data the way you want.
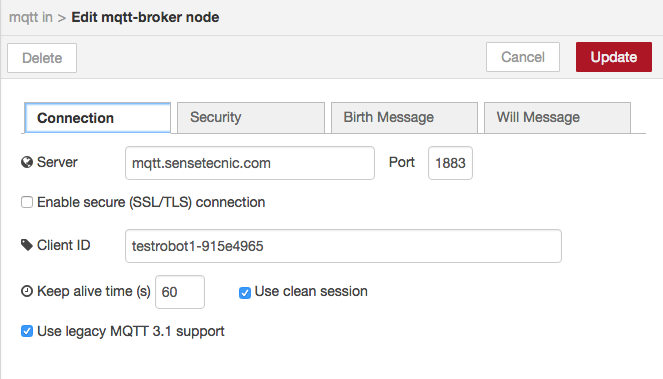
Let’s go to FRED, and set up a mqtt in node.
You will config the mqtt in node with the client you created earlier on STS-MQTT
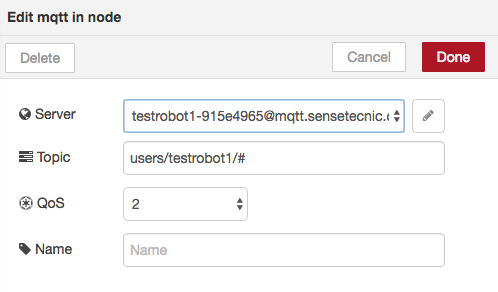
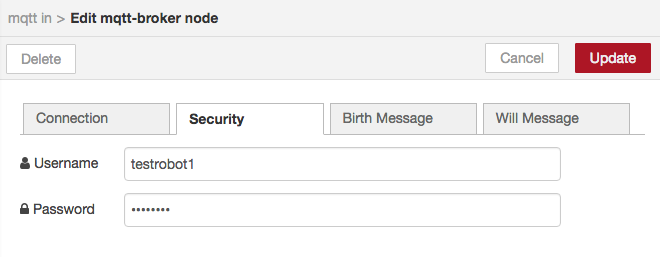
You will need to replace the Client ID, username, and password with your client information.
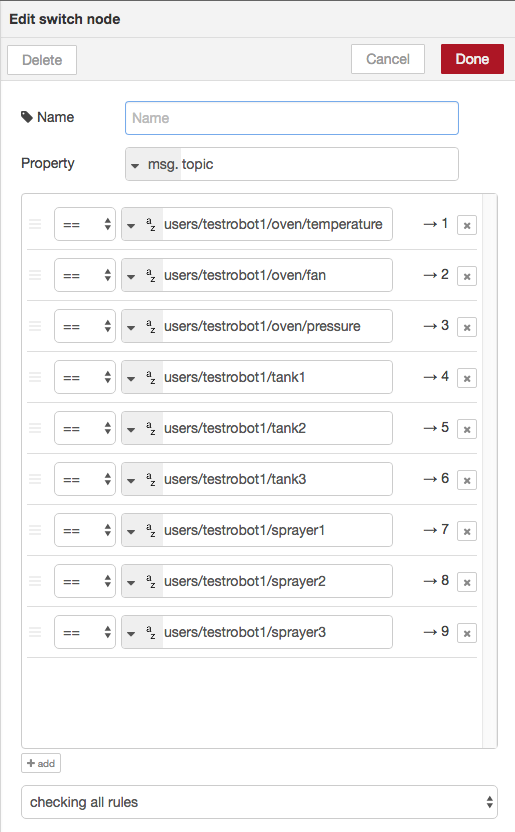
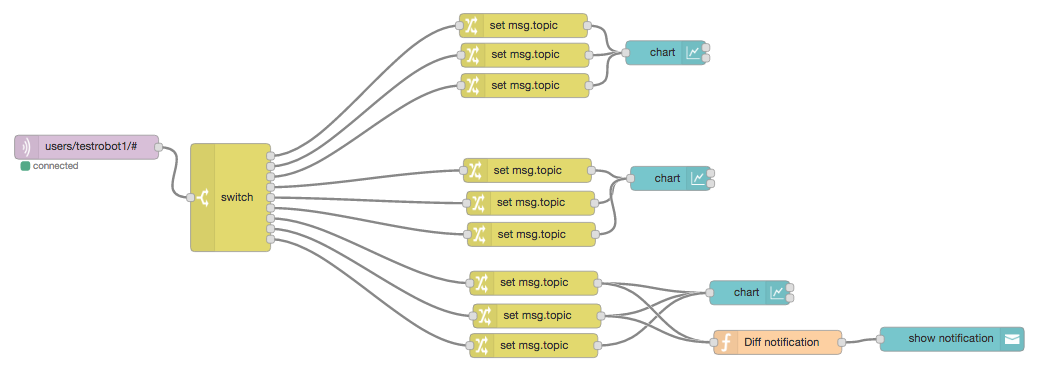
Notice in the topic field, we use a wildcard symbol “#”, this means that we will subscribe to all topics that start with “users/testrobot1”. Since we have messages from 9 topics coming from the same client, it would be a good idea to separate the messages by their topics. We can use a switch node to do that.
We will set up three charts in the UI dashboard to illustrate the real-time data. You will need three chart ui node to do that. More details on the chart node can be found in this tutorial, or you can import the sample flow code. We also added change nodes to shorten the topics, so the graphs can be easy to read. This is an optional step.
So, at the end, you should have flows like this.
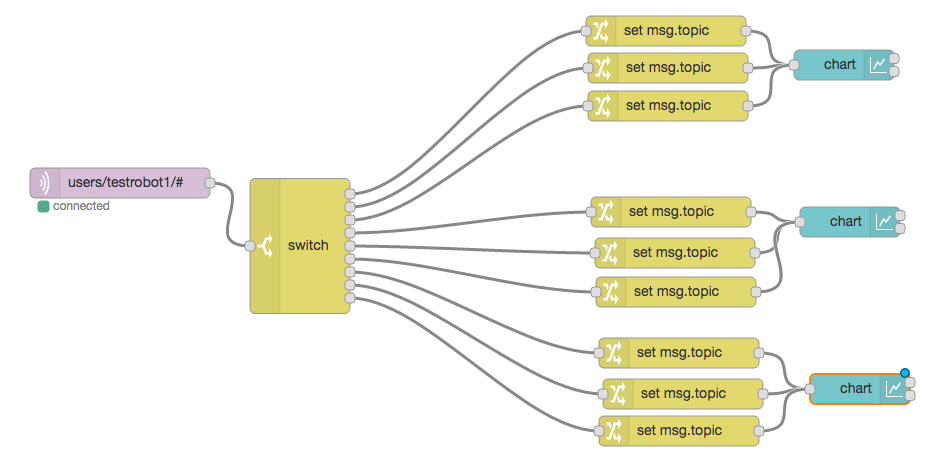
And you will see the charts in the dashboard UI.
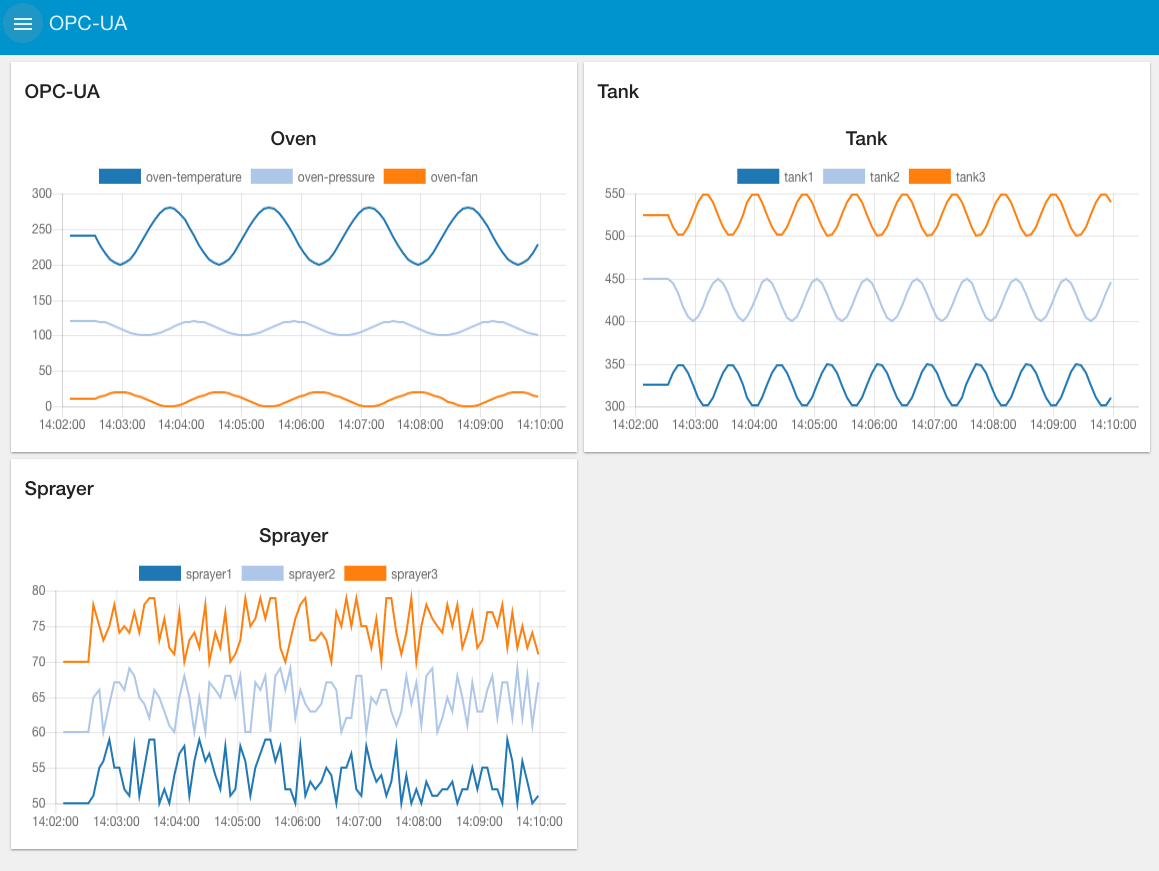
You should see that the data from oven and tanks are generated from sine waves, and the data from sprayers were randomized within a certain range.
We will illustrate a small trick here to show you how you can monitor for a certain event. As you can see, the average value for sprayer 1 is 55, and the average value for sprayer 2 is 65. Each of these values is randomized within +/- of the average value. Let’s assume a use-case where we need to monitor when the sprayer 2 value is greater than sprayer 1 by 10.
We will need to set up a function node where its input will be the values of both sprayer 1 and sprayer 2. Let’s call this function node “Diff notification”.
We will set it up like this:
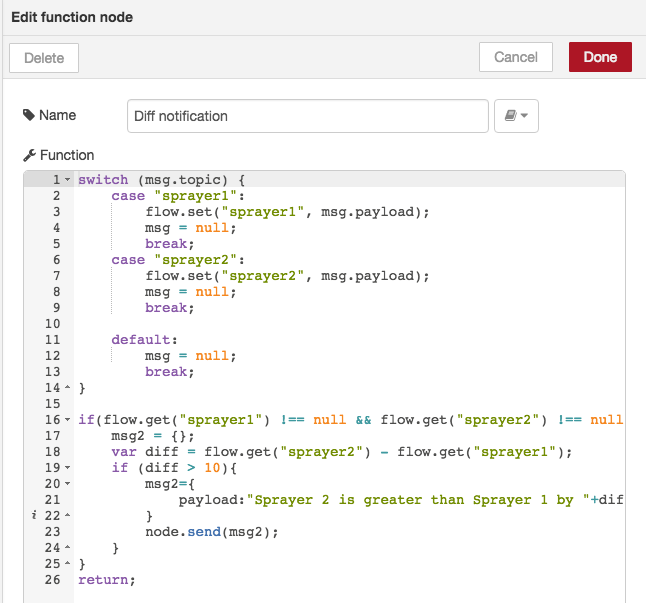
And here is the code:
switch (msg.topic) {
 case "sprayer1":
 flow.set("sprayer1", msg.payload);
 msg = null;
 break;
 case "sprayer2":
 flow.set("sprayer2", msg.payload);
 msg = null;
 break;

 default:
 msg = null;
 break;
}

if(flow.get("sprayer1") !== null && flow.get("sprayer2") !== null ) {
 msg2 = {};
 var diff = flow.get("sprayer2") - flow.get("sprayer1");
 if (diff > 10){
 msg2={
 payload:"Sprayer 2 is greater than Sprayer 1 by "+diff
 }
 node.send(msg2);
 }
}
return;
We will then connect a notification UI node after the function node. The flows will be like this.
Now, when you deploy the flow and watch the dashboard, you will see a notification shows up at top-right corner when the value of sprayer 2 is greater than sprayer 1 by 10.
This is a very simple illustration of what we can do with the incoming data on FRED. I am sure you can come up with some more meaningful ways to make use of FRED with your real data.
Also as an exercise, can you think of a way to simplify the flows to get all the data we need into the topics with fewer nodes?
Troubleshooting
- How do I check if my KEPServer is running?
You can do this by using the Demo Applications(.NET) in QuickOPC. If you are able to see details of each data element, then your KEPServer is up running.
- How to find the datatypes of a data source?
In the main window of KEPServerEX configuration, you will be able to find the data type of each data element.
- I am not receiving data from the OPC-UA node.
Here is a checklist on debugging what could be wrong:
-Double check your OPC endpoint address
-Double check if your OPC server is up running
-Are you using the correct information on the node id for each OPC-UA data element? You can find them in the QuickOPC tool.
-Are you using the correct datatype?
-The Inject node triggers the READ action of the OPC-UA node, is your Inject node repeating with a time interval or are you manually injecting?
- I receive data from the OPC-UA node, but I am not receiving/sending data on Windows Node-RED/FRED.
You can check this tutorial to find troubleshooting tips on STS-MQTT.
- I don’t see the charts as shown in this tutorial.
You can check this tutorial on how to use the dashboard.
About Sense Tecnic: Sense Tecnic Systems Inc have been building IoT applications and services since 2010. We provide FRED, cloud hosted Node-RED as a service to the community. We also offer a commercial version to our customers, as well as professional services. Learn more.