

In this guide you will learn how to implement a simple outlier analysis to find values in an array that are outside of the norm. This is very useful when trying to detect anomalies in data sets. We will implement a Node-RED function that uses inter-quartile outlier analysis (http://en.wikipedia.org/wiki/Interquartile_range) to detect values that are not “normal”.
What is Node RED?
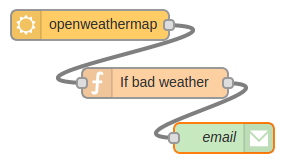
Node-RED is a visual tool for wiring the Internet of Things developed by IBM Emerging Technology and the open source community. Using Node-RED, developers wire up input, output and processing nodes to create flows to process data, control things, or send alerts. It works by allowing you to wire up web services or custom “nodes” to each other, or to things, to do things like:
- Send an email on a rainy weather forecast.
- Push sensor data to services like Twitter.
- Perform complex analysis on data with ease.
 If you’re new to Node RED you might find our Introduction to Node RED tutorial very helpful.
What is FRED
Front End for Node-RED (FRED) manages instances of Node-RED for multiple users in the cloud. We manage and optimize your instance of Node RED so you worry about accomplishing your project, not setting up and maintaining your Node-RED instance.
Create a FRED Account
To begin our tutorial create your own Node-RED instance in the cloud. Register for a free account at http://fred.sensetecnic.com.
After registering make sure to activate your account via your email. You will not be able to login until you validate your account.
Implementing a Node-RED outlier analysis function
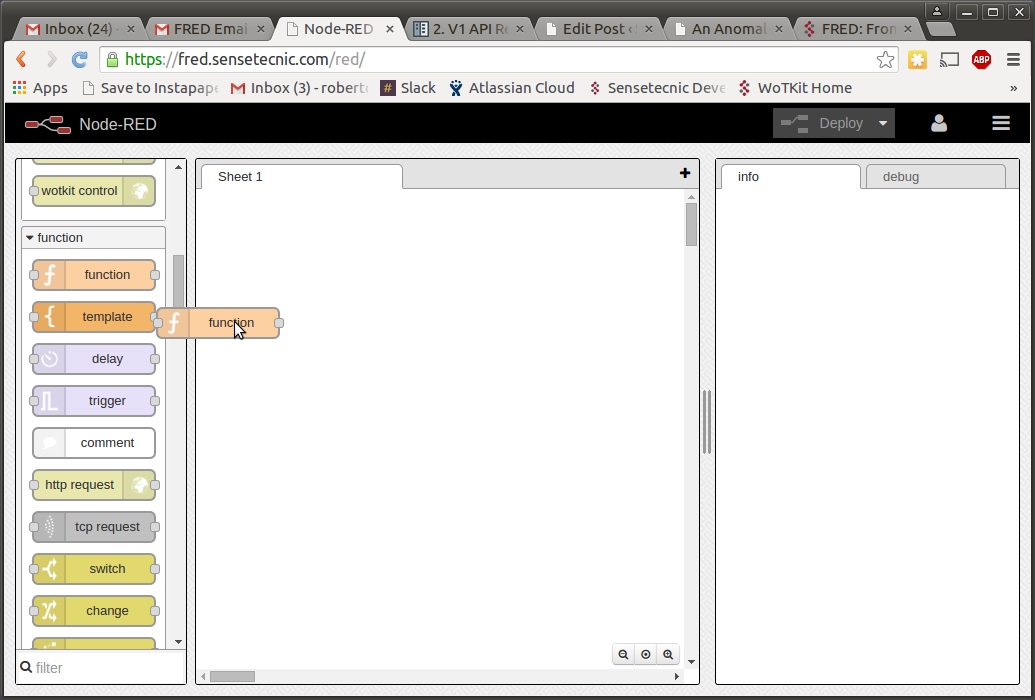
We will start by inserting a Function node from the left pane in FRED. Drag and drop a “Function” node onto the working canvas.
Double clicking on the inserted node we will be presented with a modal window where we can type code.
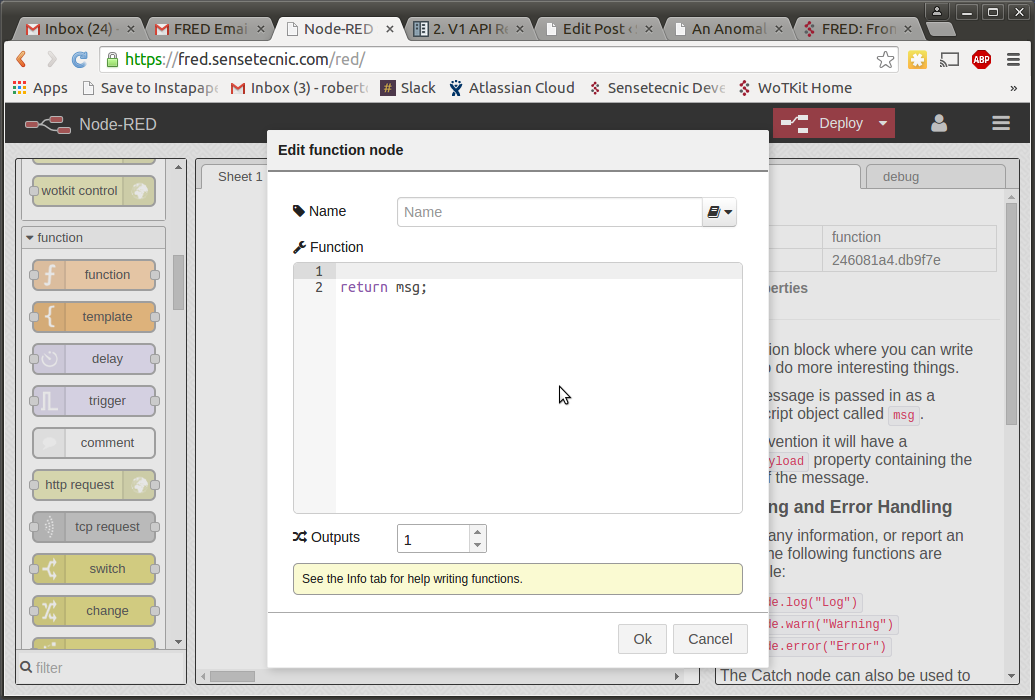
Nodes in Node-RED have input and output. Both consist of JSON objects in the form:
[cc lang=”javascript”]
message = { payload : “Hello World!”};
[/cc]Common elements of messages are: payload and topic. For our function we will be using the “payload” element in our message object.
For this example we will be analyzing an array of data. Assuming that our input is in the form:
[cc]
msg = { payload: [15, 17, 19, 16, 14, 58] };
[/cc].Let’s begin by copying the message payload to an array variable, and sorting it:
[cc]
array = msg.payload;
//array = [15, 17, 19, 16, 14, 58]; //or you can use this test array
array.sort();
[/cc]How interquartile works (http://en.wikipedia.org/wiki/Interquartile_range) is measures the difference between the upper and lower quartiles. Quartiles are the points that divide the data into 4 equal parts.
We achieve this by computing the median of all the data to divide it in two groups: data-left and data-right. We then compute the median of each of these sub-sets to divide it in two groups: data-left-1, data-left-2; data-right-1, data-right-2. So let’s implement a function to find the median of an array:
[cc]
/*get median, return [position, value]*/
function getMedian (m) {
var middle = Math.floor((m.length – 1) / 2); // NB: operator precedence
if (m.length % 2) {
return [middle, m[middle]];
} else {
return [middle, (m[middle] + m[middle + 1]) / 2.0];
}
}
[/cc]We can now apply this function to find the three medians that divide our data in four parts:
[cc]
var q2 = getMedian(array);
var q1 = getMedian( array.slice(0, q2[0]+1) );
var q3 = getMedian( array.slice(q2[0]+1, array.length) );
[/cc]and use these to find the interquartile range:
[cc]
var iqr = q3[1] – q1[1]; //The interquartile range
[/cc]This is the range where most of the data will fall into. However, we want to find any data points that lie outside of this range. So we compute the low and high threshold by creating a boundary on both sides of the range:
[cc]
var tlo = q1[1] – 1.5 * iqr ;//low threshold
var thi = q3[1] + 1.5 * iqr ;//high threshold
[/cc]Anything that lies outside of these boundaries can be considered an outlier. We will write a function that will return a message if an outlier is found. To make it a trigger we will return null (in Node-RED null messages are ignored by nodes) if all data is normal.
[cc]
if (array[0] < tlo || array[array.length – 1] > thi) {
msg.topic = “Alert from FRED”
msg.payload = “Outlier Analysis triggered. A value was found outside: ” +tlo + ” and ” + thi;
return msg;
} else {
return null;
}
[/cc]In the case of the example array mentioned above
[cc][15, 17, 19, 16, 14, 58][/cc]
it will become evident that the integer
58
will be detected as not normal.
All together
[cc]
array = msg.payload;//array = [15, 17, 19, 16, 14, 58]; //test array
array.sort();/*get median, return [position, value]*/
function getMedian (m) {
var middle = Math.floor((m.length – 1) / 2); // NB: operator precedence
if (m.length % 2) {
return [middle, m[middle]];
} else {
return [middle, (m[middle] + m[middle + 1]) / 2.0];
}
}var q2 = getMedian(array);
var q1 = getMedian( array.slice(0, q2[0]+1) );
var q3 = getMedian( array.slice(q2[0]+1, array.length) );var iqr = q3[1] – q1[1]; //The interquartal range
var tlo = q1[1] – 1.5 * iqr ;//low threshold
var thi = q3[1] + 1.5 * iqr ;//high thresholdif (array[0] < tlo || array[array.length – 1] > thi) {
msg.topic = “Alert from FRED”
msg.payload = “Outlier Analysis triggered. A value was found outside: ” +tlo + ” and ” + thi;
return msg;
} else {
return null;
}
[/cc]
I think your code examples are out of date/ wrong display!
hello Fred, the ui display are from an older version. but the code should be still working