

This tutorial is a basic introduction to the basics of Node RED. You will learn about node inputs, outputs, messages, deploying and debugging a Node RED flow.
What is Node RED?
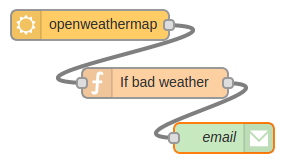
Node-RED is a visual tool for wiring the Internet of Things developed by IBM Emerging Technology and the open source community. Using Node-RED, developers wire up input, output and processing nodes to create flows to process data, control things, or send alerts. It works by allowing you to wire up web services or custom “nodes” to each other, or to things, to do things like:
- Send an email on a rainy weather forecast.
- Push sensor data to services like Twitter.
- Perform complex analysis on data with ease.
What is FRED
Front End for Node-RED (FRED) manages instances of Node-RED for multiple users in the cloud. We manage and optimize your instance of Node RED so you worry about accomplishing your project, not setting up and maintaining your Node-RED instance. You can your own Node-RED instance in the cloud. Register for a free account at https://fred.sensetecnic.com. After registering make sure to activate your account via your email.
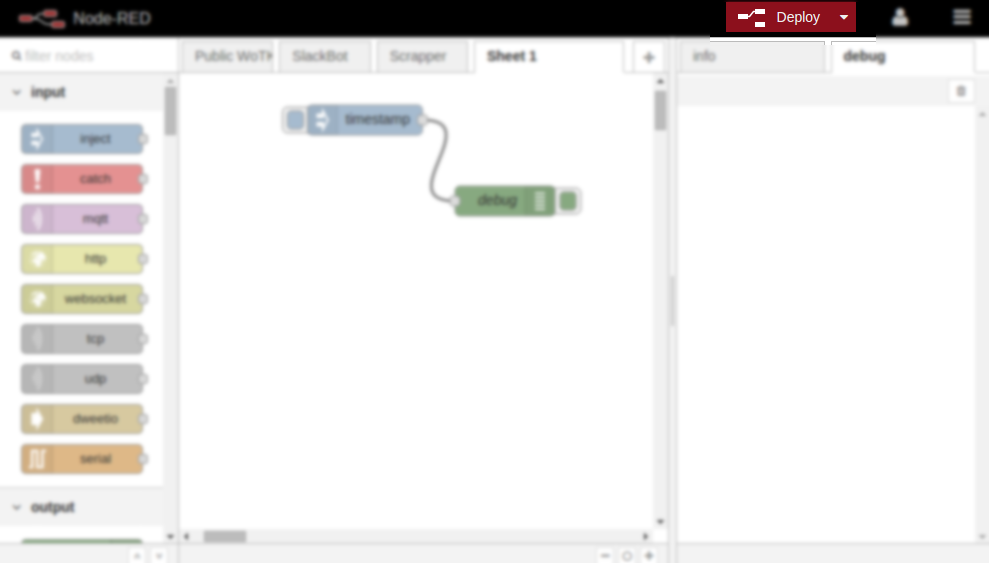
Node RED Panel
Node RED has three main components.
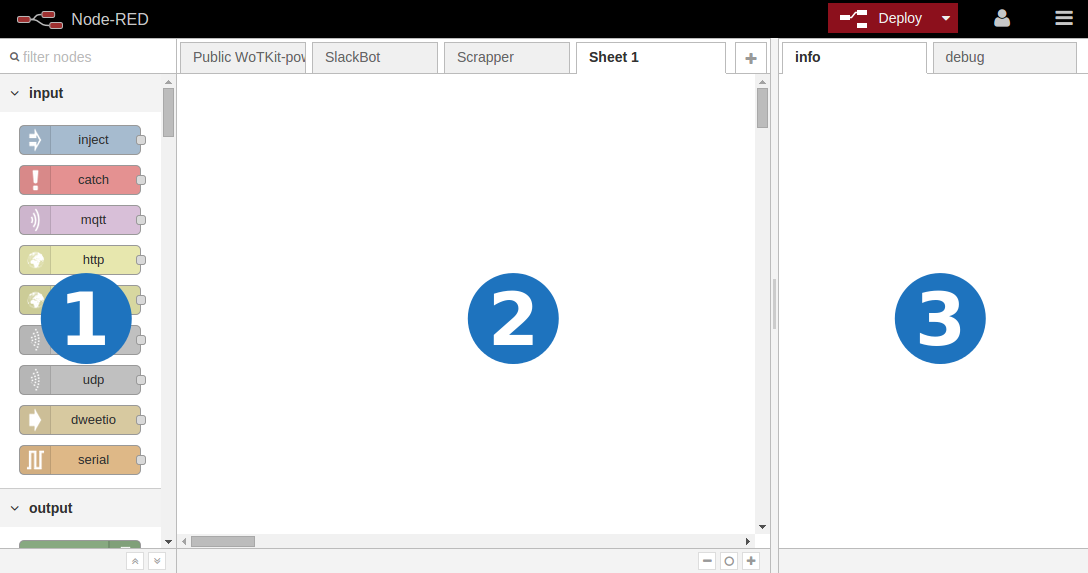
- Node Panel
- Sheets Panel
- Info and Debug Panel.
The Node Panel (1) contains a list of nodes that you can use, nodes are organized by categories. Categories include “input”, “output”, “function”, “social”, “storage” and others. Node RED comes with a selection of nodes you can use out of the box. FRED provides and maintains extra nodes and we are always growing that selection.
The Sheets Panel (2) is your main working space. You create Node RED “flows” by placing nodes in sheets and wiring them together. To place a node on a Sheet you drag and drop that node from the Node Panel (1) onto the Sheet Panel (2).
The Info and Debug Panel (3) contains two tabs, “info” and “debug”. The info tab provides information about a node when it’s clicked on the Sheet Panel (2); such information can help you understand how such node functions and gives you information about its type, properties, usage and required configuration. The debug tab provides information printed with the “debug” node, to print to the debug console you must have a debug node in the Sheet Panel (2). In some cases, when nodes need to output error messages they are printed onto the debug tab in the Info and Debug Panel (3).
Node RED Nodes
Node RED nodes consume input messages and produce output messages. Messages are Javascript Object Notation objects (JSON) that contain at least a “payload” parameter, like this:
[javascript]
msg = {
payload:”message payload”
}
[/javascript]
Nodes consume and produce messages, often using msg.payload as the main placeholder for the data they consume and produce. Often, however, messages can be extended to contain other parameters, for example:
[javascript]
msg = {
payload:”message payload”,
topic:”error”,
location:”somewhere in space and time”
}
[/javascript]
It is up to each node to decide which parameter to use.
There are three types of nodes:
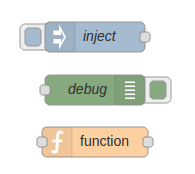
- Input Nodes (e.g. inject)
- Ouput Nodes (e.g. debug)
- Processing Nodes (e.g. function)
Input Nodes allow you to input data into a Node RED application, or “flow”. They have a white square only on their right side. You use input nodes to bring data from other services, for example twitter, google, serial, websockets or tcp, or to manually input data into a flow, for example the inject node.
Output Nodes allow you to output data outside of a Ned RED application, or “flow”. They have a white square only on their left side. You use output nodes to send data to other services, for example, twitter, tcp, serial or email, or to use the “debug” console.
Processing Nodes allow you to process data. They have white squares on both left and right sides. They allow you to transform the data (e.g. json, csv, xml), use the data to trigger a message (e.g. trigger, delay), or to write custom code that uses the data received (e.g. function).
Note that some nodes, like the Inject and debug messages have a button that allow you to actuate a node (in the case of the inject node) or to enable and disable a node (in the case of the debug node).
Configuring Nodes
To configure nodes you double click on a node, which will present you with a form with options for that particular node. In this case we have clicked on the “inject” node.
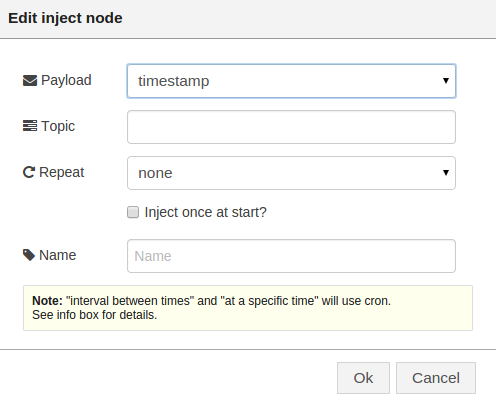
Each node configuration is unique, but you can always understand how to use a node by clicking on it and reading the info tab on the Info and Debug Panel.
Node RED Flows
You build Node RED “applications” by connecting together nodes by drawing a line between the white squares to the left and right of nodes. When you connect nodes you create “Flows”. The left white square represent a node’s input while the left white square represent a node’s output. Thus, in flows data moves from left to right. In the following example, the inject node (when the blue button on its left side is pressed) produces a timestamp that is consumed by the debug node and printed on the debug console.
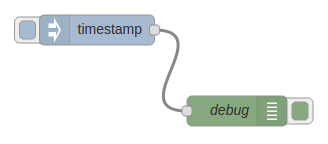
To wire this example you click on the right square of the inject (timestamp) node and drag a line until the left square of the debug node.
Deploying
Once you have created a flow you need to deploy it. To deploy it you simply click on the “Deploy” button located on the right side of the top menu bar.
Note: Whenever you make a change to your flow, you must re-deploy your changes by clicking on the “Deploy” button again.
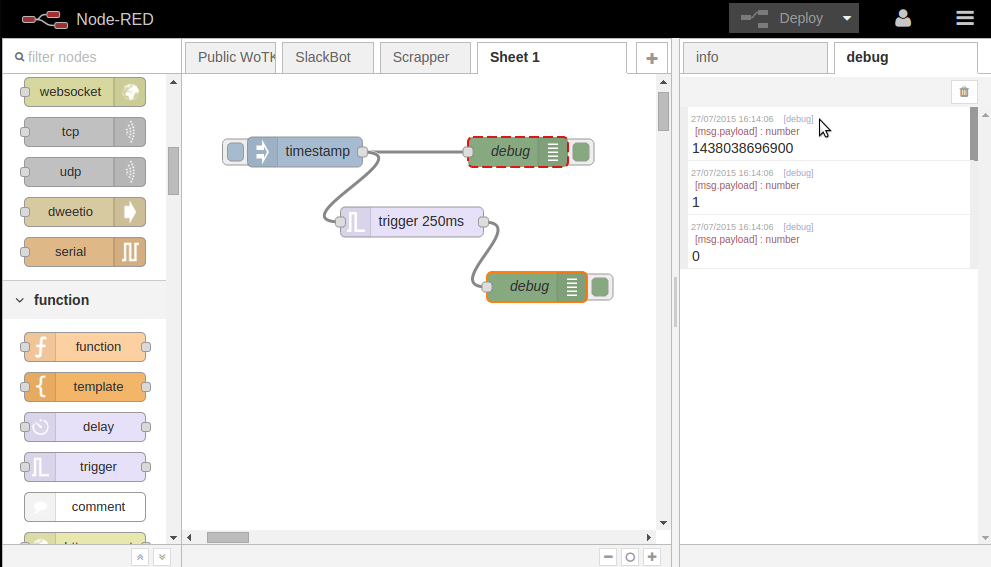
Debugging
You have created your flow and you want to debug it. In Node RED you achieve this by adding a “debug” node and inspecting the debug tab in the Info and Debug Panel. For example, in the following flow we have connected an inject node (timestamp) that produces a timestamp. We have connected this node to a trigger node that sends the message 1 (msg.payload = 1) waits for 250 milliseconds and sends the message 0. We have connected two debug nodes that will print to the debug tab. When we hover over the first message we see that the top debug node connected directly to the timestamp is highlighted in the Sheet Panel. This way we can understand which node is producing each debug message.
What next
Ready to start building flows? Here is a list of tutorials that will get you started:
Create a Node RED Flow
Use Dweet.io from FRED
A Node RED Flow to monitor the weather
We also maintain a full set of lectures on using Node-RED. The lecture course takes you from the basics, right through to advanced flows. You can access them at: http://noderedguide.com/